GME Weekly Technical Analysis
GameStop Corp.
Video game retailer that became a meme stock with significant retail following.
GME Technical Analysis Summary
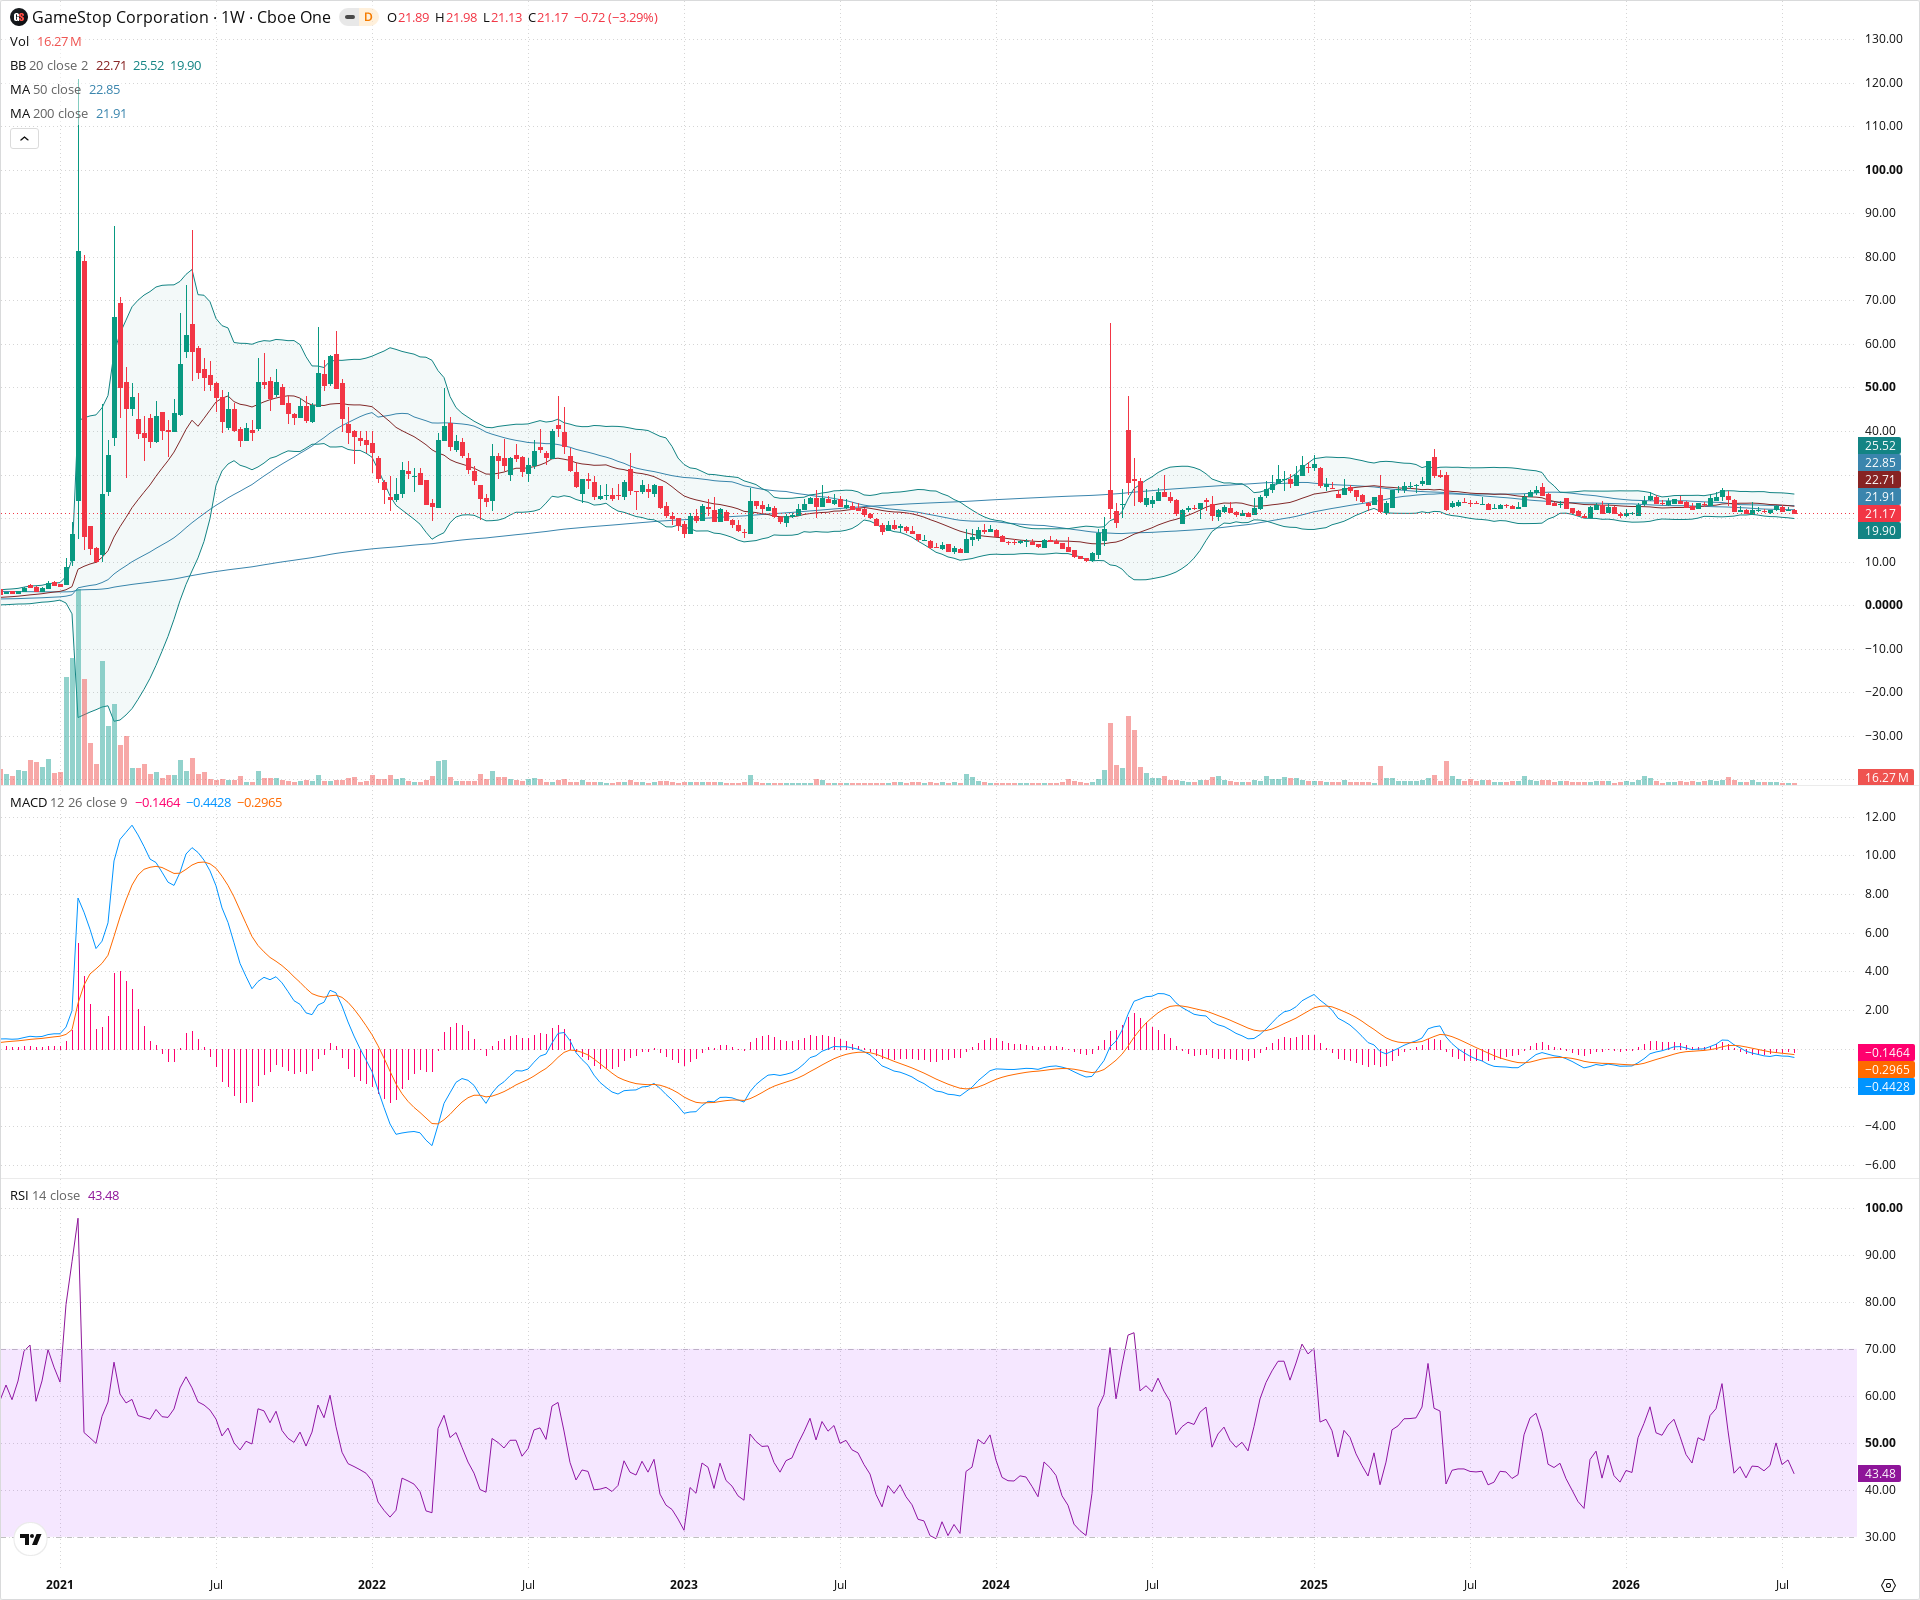
GME is currently locked in a prolonged, multi-year consolidation phase following a massive historical downtrend. The stock is tightly compressed but remains pinned below major moving averages, with the 50-week and 200-week SMAs acting as significant overhead resistance. A decisive weekly close above the 26 level is required to shift the macro momentum, while a breakdown below 15 would signal a resumption of the primary downtrend.
Included In Lists
Related Tickers of Interest
GME Weekly Chart
Sentiment
Short-term Sentiment (days to weeks): Neutral
Price is consolidating in a tight multi-week range with Bollinger Bands contracting. MACD is flat and resting near the zero line, indicating a lack of clear directional momentum.
Long-term Sentiment (weeks to months): Bearish
The stock remains in a multi-year downtrend structure, trading below both the 50-week and 200-week SMAs. The 50-week SMA is positioned below the 200-week SMA, confirming long-term weakness.
Report Metadata
- Timeframe: weekly
- Generated at: 2026-07-25T09:07:35.601Z
- Model: gemini-3.1-pro-preview
Support Price Levels
| Level | Range | Strength | Notes |
|---|---|---|---|
| $16.00 | $15.00 - $17.00 | Strong | Recent consolidation lows and a key swing low support zone from late 2023. |
| $11.00 | $10.00 - $12.00 | Strong | Major structural swing low established in early 2024. |
Resistance Price Levels
| Level | Range | Strength | Notes |
|---|---|---|---|
| $23.70 | $21.90 - $25.50 | Strong | Heavy confluence of overhead resistance including the 200-week SMA, 50-week SMA, and upper Bollinger Band. |
| $32.50 | $30.00 - $35.00 | Strong | Prior major swing highs from late 2022 and mid-2023. |
Potential Chart Patterns in Formation
| Strength | Pattern | Signal | Target | Details |
|---|---|---|---|---|
| Strong | Long-Term Consolidation Base | Neutral | N/A | Price has transitioned from a sharp multi-year downtrend into an extended sideways consolidation phase, characterized by lower highs but a stabilizing floor. |
Frequently Asked Questions about GME
What is the current sentiment for GME?
The short-term sentiment for GME is currently Neutral because Price is consolidating in a tight multi-week range with Bollinger Bands contracting. MACD is flat and resting near the zero line, indicating a lack of clear directional momentum.. The long-term trend is classified as Bearish.
What are the key support levels for GME?
StockDips.AI has identified key support levels for GME at $16.00 and $11.00. These levels may represent potential accumulation zones where buying interest could emerge.
Is GME in a significant dip or a Value Dip right now?
GME has a Value Score of 63/100. It is not currently flagged as a significant dip in the Top Dips list. It is not listed as a Value Dip because the long-term sentiment or value-score threshold does not qualify.
View the full interactive analysis on StockDips.AI.