MSTR Daily Technical Analysis
MicroStrategy Inc
Enterprise analytics firm widely known for holding significant Bitcoin on its balance sheet.
MSTR Technical Analysis Summary
MSTR remains firmly entrenched in a primary long-term downtrend, dominated by persistent selling pressure and negative moving average alignment. The recent failure to hold consolidation support suggests a resumption of short-term bearish momentum. Long-term investors should exercise extreme caution as the technical picture remains heavily skewed to the downside until a significant structural shift or base-building occurs.
Included In Lists
Related Tickers of Interest
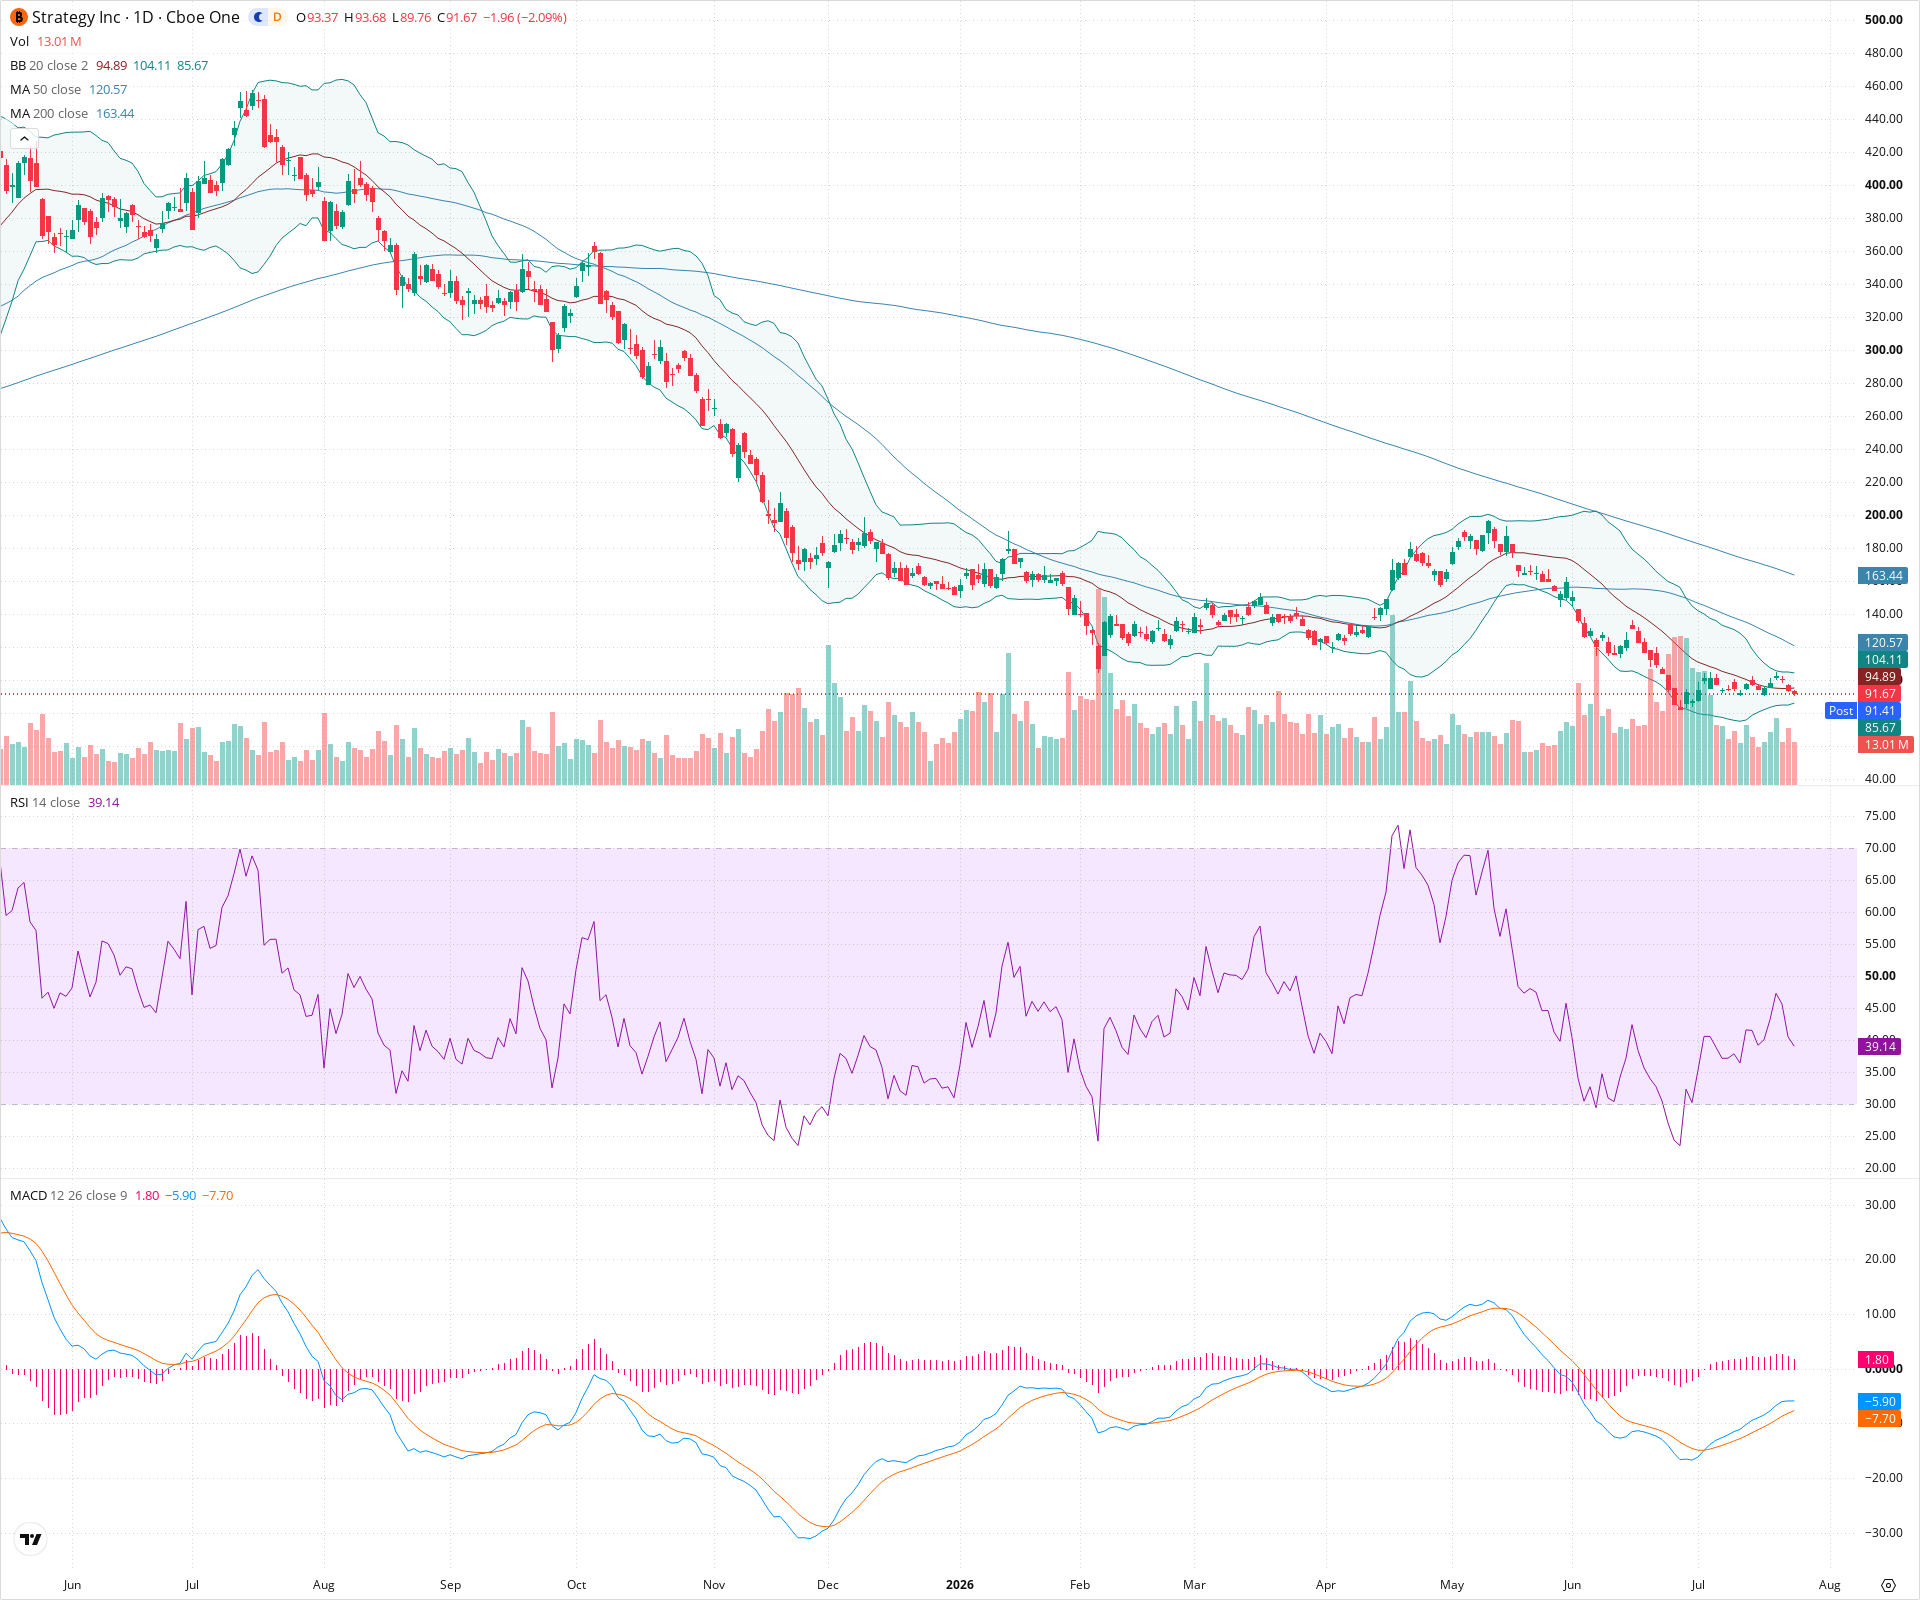
MSTR Daily Chart
Sentiment
Short-term Sentiment (days to weeks): Bearish
Price is breaking down from a recent consolidation phase, closing near the lower Bollinger Band, and remaining below a declining 20-day SMA. RSI is also trending downward towards oversold territory.
Long-term Sentiment (weeks to months): Bearish
The macro structure is a clear and sustained downtrend with lower highs and lower lows. Price is substantially below a steeply declining 200-day SMA, confirming strong long-term downward momentum.
Report Metadata
- Timeframe: daily
- Generated at: 2026-07-24T21:09:16.698Z
- Model: gemini-3.1-pro-preview
Support Price Levels
| Level | Range | Strength | Notes |
|---|---|---|---|
| $87.50 | $85.00 - $90.00 | Strong | Major previous swing low zone established earlier in the chart's timeline, aligning with the current position of the lower Bollinger Band. |
Resistance Price Levels
| Level | Range | Strength | Notes |
|---|---|---|---|
| $107.00 | $104.00 - $110.00 | Weak | Initial overhead resistance defined by the 20-day SMA and the breakdown level of the recent consolidation zone. |
| $121.50 | $118.00 - $125.00 | Strong | Significant structural resistance containing the 50-day SMA and the peaks of the previous consolidation range. |
Potential Chart Patterns in Formation
| Strength | Pattern | Signal | Target | Details |
|---|---|---|---|---|
| Strong | Consolidation Breakdown | Bearish | N/A | Price recently traded in a tight lateral range before breaking down below its local support, signaling a likely continuation of the broader downtrend. |
Frequently Asked Questions about MSTR
What is the current sentiment for MSTR?
The short-term sentiment for MSTR is currently Bearish because Price is breaking down from a recent consolidation phase, closing near the lower Bollinger Band, and remaining below a declining 20-day SMA. RSI is also trending downward towards oversold territory.. The long-term trend is classified as Bearish.
What are the key support levels for MSTR?
StockDips.AI has identified key support levels for MSTR at $87.50. These levels may represent potential accumulation zones where buying interest could emerge.
Is MSTR in a significant dip or a Value Dip right now?
MSTR has a Value Score of 79/100. It is currently flagged as a significant dip in the Top Dips list. It is not listed as a Value Dip because the long-term sentiment or value-score threshold does not qualify.
View the full interactive analysis on StockDips.AI.