HIMS Daily Technical Analysis
Hims & Hers Health Inc
Telehealth company offering wellness, skincare, and mental health treatments online.
HIMS Technical Analysis Summary
The technical outlook for HIMS has turned severely bearish following an aggressive high-volume breakdown. The stock has decisively sliced through major moving averages (50 and 200 SMA), invalidating the prior uptrend. With momentum indicators pointing sharply downward and price outside the lower Bollinger Band, selling pressure is dominant, and the stock is likely to seek lower structural support zones.
Included In Lists
Related Tickers of Interest
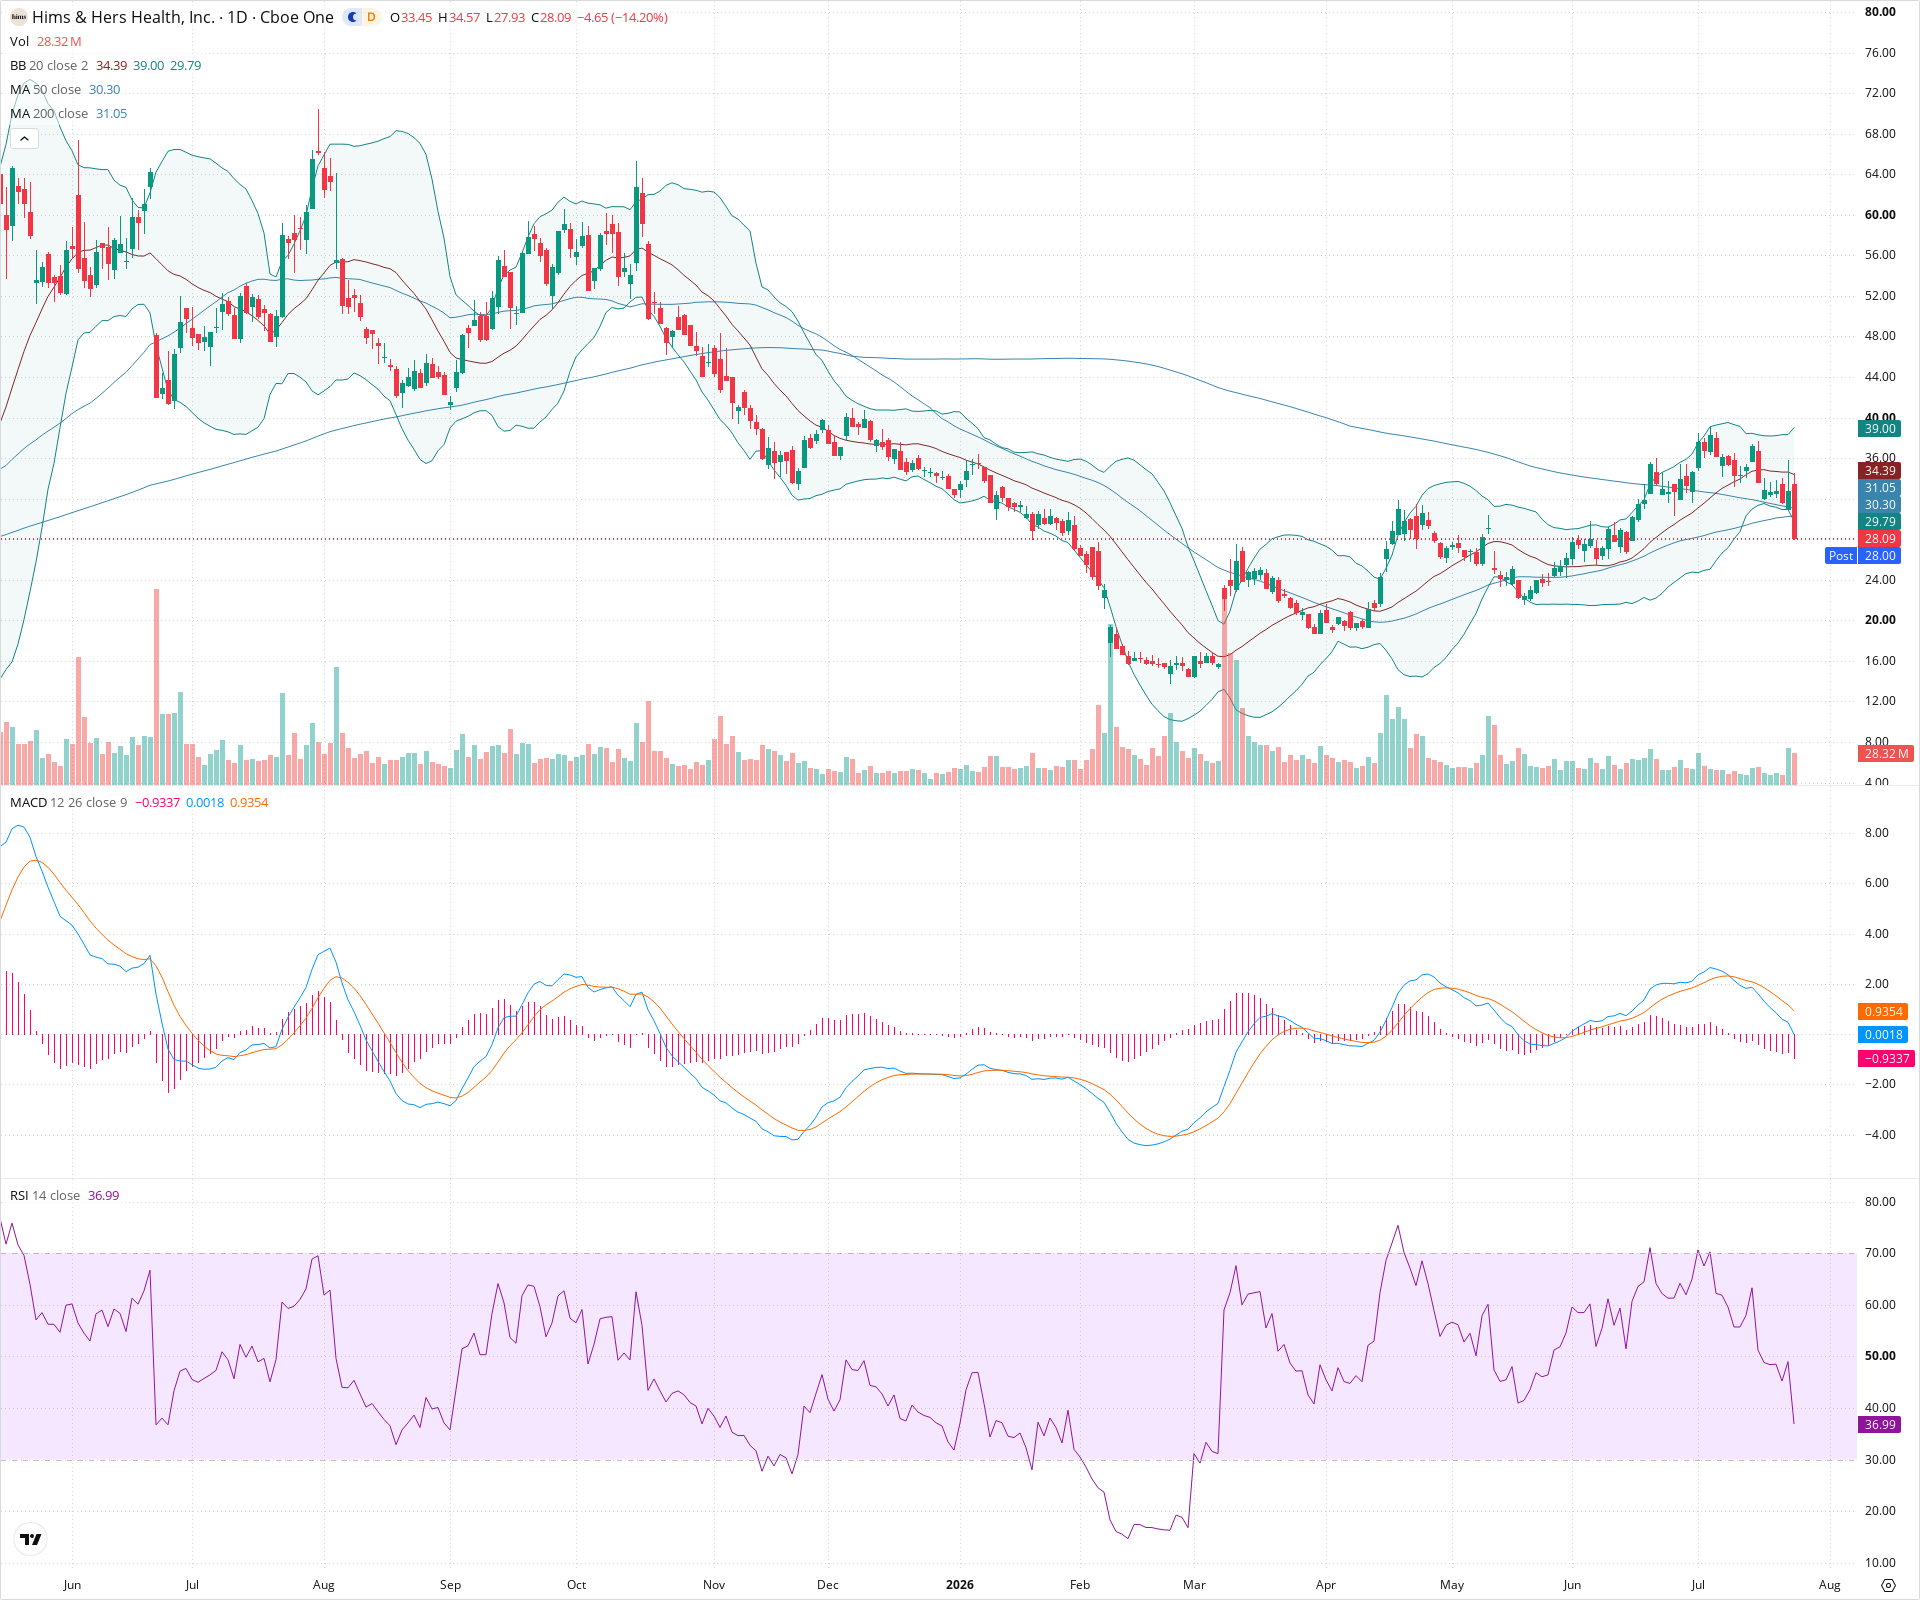
HIMS Daily Chart
Sentiment
Short-term Sentiment (days to weeks): Bearish
Price experienced a massive high-volume selloff, breaking decisively below both the 50-day and 200-day SMAs. The current price closed outside the lower Bollinger Band, MACD shows a fresh bearish crossover with expanding negative histogram, and RSI is plummeting sharply.
Long-term Sentiment (weeks to months): Bearish
The severe break below the 200-day moving average on extraordinary volume invalidates the medium-term uptrend. The failure to hold this key level suggests a structural shift in momentum, likely ushering in a prolonged period of weakness or consolidation.
Report Metadata
- Timeframe: daily
- Generated at: 2026-07-24T21:08:48.198Z
- Model: gemini-3.1-pro-preview
Support Price Levels
| Level | Range | Strength | Notes |
|---|---|---|---|
| $24.75 | $24.00 - $25.50 | Strong | Previous major swing low and consolidation zone from April and May. This is the next significant structural area below current price. |
| $17.00 | $16.00 - $18.00 | Strong | Historical base and absolute low visible on the current chart from February and March. |
Resistance Price Levels
| Level | Range | Strength | Notes |
|---|---|---|---|
| $31.00 | $30.00 - $32.00 | Strong | This zone contains the recently broken 50-day and 200-day SMAs. What was previously support will now act as a significant overhead resistance ceiling. |
| $37.00 | $36.00 - $38.00 | Strong | Recent swing highs prior to the massive breakdown; represents heavy overhead supply. |
Potential Chart Patterns in Formation
| Strength | Pattern | Signal | Target | Details |
|---|---|---|---|---|
| Strong | High-Volume Breakdown | Bearish | $25.00 | A massive, single-day bearish engulfing-style candle accompanied by the highest volume seen on the chart. This move decisively broke through critical long-term support levels (50 & 200 SMAs), indicating a strong shift in market control to sellers. |
Frequently Asked Questions about HIMS
What is the current sentiment for HIMS?
The short-term sentiment for HIMS is currently Bearish because Price experienced a massive high-volume selloff, breaking decisively below both the 50-day and 200-day SMAs. The current price closed outside the lower Bollinger Band, MACD shows a fresh bearish crossover with expanding negative histogram, and RSI is plummeting sharply.. The long-term trend is classified as Bearish.
What are the key support levels for HIMS?
StockDips.AI has identified key support levels for HIMS at $24.75 and $17.00. These levels may represent potential accumulation zones where buying interest could emerge.
Is HIMS in a significant dip or a Value Dip right now?
HIMS has a Value Score of 47/100. It is not currently flagged as a significant dip in the Top Dips list. It is not listed as a Value Dip because the long-term sentiment or value-score threshold does not qualify.
View the full interactive analysis on StockDips.AI.