HIMS Weekly Technical Analysis
Hims & Hers Health Inc
Telehealth company offering wellness, skincare, and mental health treatments online.
HIMS Technical Analysis Summary
HIMS is undergoing a severe technical correction following a sharp rejection near the $40 level. The breakdown below the 50-week SMA, accompanied by bearish momentum shifts in both MACD and RSI, suggests near-term weakness will persist. For long-term investors, the critical area to watch is the $22-$24 zone, where the 200-week SMA meets historical breakout support; holding this level is vital to maintain the longer-term structural recovery.
Included In Lists
Related Tickers of Interest
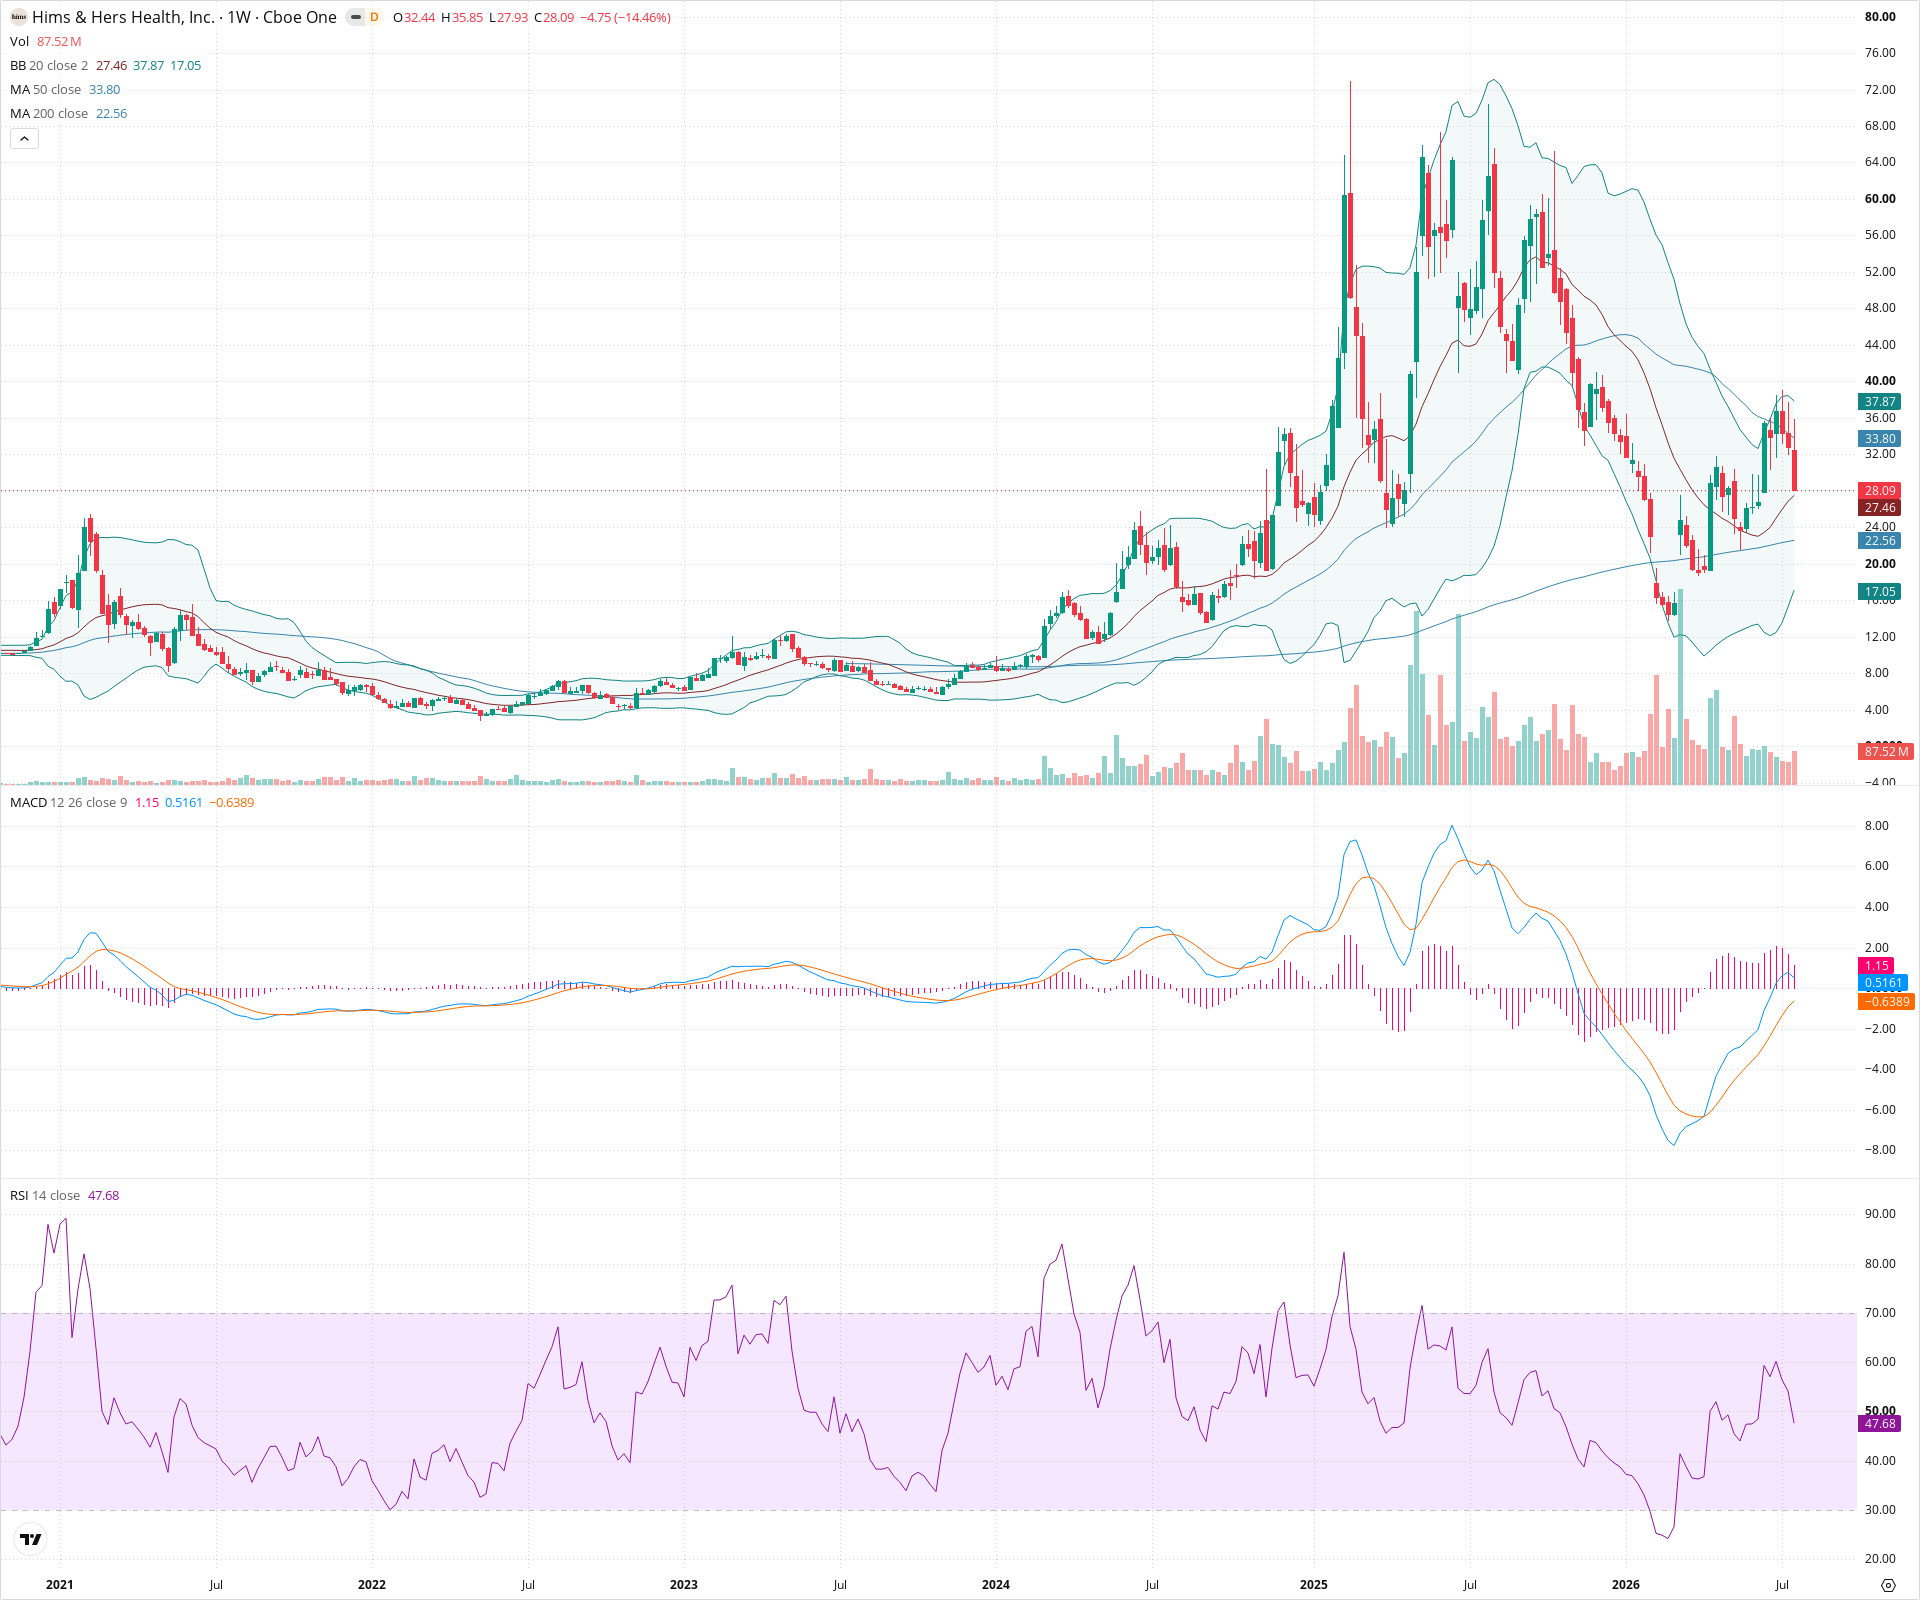
HIMS Weekly Chart
Sentiment
Short-term Sentiment (days to weeks): Bearish
Price has suffered a massive weekly drop, breaking significantly below the 50-week SMA. The MACD has crossed bearishly with an expanding negative histogram, and RSI has fallen below 50, indicating strong downward momentum.
Long-term Sentiment (weeks to months): Neutral
While the longer-term structure shows recovery from all-time lows and price remains above the 200-week SMA, the severity of the recent rejection near $40 and loss of the 50-week SMA damages the immediate uptrend, shifting the posture to a broad consolidation or correction phase.
Report Metadata
- Timeframe: weekly
- Generated at: 2026-07-25T09:07:50.099Z
- Model: gemini-3.1-pro-preview
Support Price Levels
| Level | Range | Strength | Notes |
|---|---|---|---|
| $23.50 | $22.50 - $24.50 | Strong | Confluence of the rising 200-week SMA (currently 22.56) and a major prior structural consolidation zone that should act as strong resistance-turned-support. |
| $17.00 | $16.00 - $18.00 | Weak | Historical swing lows and a base of consolidation from late 2023. |
Resistance Price Levels
| Level | Range | Strength | Notes |
|---|---|---|---|
| $33.50 | $32.50 - $34.50 | Strong | Immediate overhead supply zone encompassing the recently broken 50-week SMA (33.80). |
| $40.00 | $38.00 - $42.00 | Strong | The recent double-top structural high area where massive selling pressure originated. |
Potential Chart Patterns in Formation
| Strength | Pattern | Signal | Target | Details |
|---|---|---|---|---|
| Strong | Double Top Rejection | Bearish | N/A | Price attempted to break the $40 level twice in recent weeks but failed, resulting in a violent bearish reversal and breakdown of near-term support. |
Frequently Asked Questions about HIMS
What is the current sentiment for HIMS?
The short-term sentiment for HIMS is currently Bearish because Price has suffered a massive weekly drop, breaking significantly below the 50-week SMA. The MACD has crossed bearishly with an expanding negative histogram, and RSI has fallen below 50, indicating strong downward momentum.. The long-term trend is classified as Neutral.
What are the key support levels for HIMS?
StockDips.AI has identified key support levels for HIMS at $23.50 and $17.00. These levels may represent potential accumulation zones where buying interest could emerge.
Is HIMS in a significant dip or a Value Dip right now?
HIMS has a Value Score of 47/100. It is not currently flagged as a significant dip in the Top Dips list. It is not listed as a Value Dip because the long-term sentiment or value-score threshold does not qualify.
View the full interactive analysis on StockDips.AI.