LFMD Weekly Technical Analysis
LifeMD Inc
Telehealth company offering online medical consultations and prescription treatments.
LFMD Technical Analysis Summary
LFMD is currently in a severe, sustained weekly downtrend following a structural breakdown from a massive topping pattern. The technical posture is deeply bearish, characterized by price trading below all major moving averages, a recent weekly 'death cross' of the 50/200 SMAs, and confirming negative momentum on the MACD. The path of least resistance remains firmly to the downside until significant resistance zones above 5.00 can be reclaimed.
Included In Lists
Related Tickers of Interest
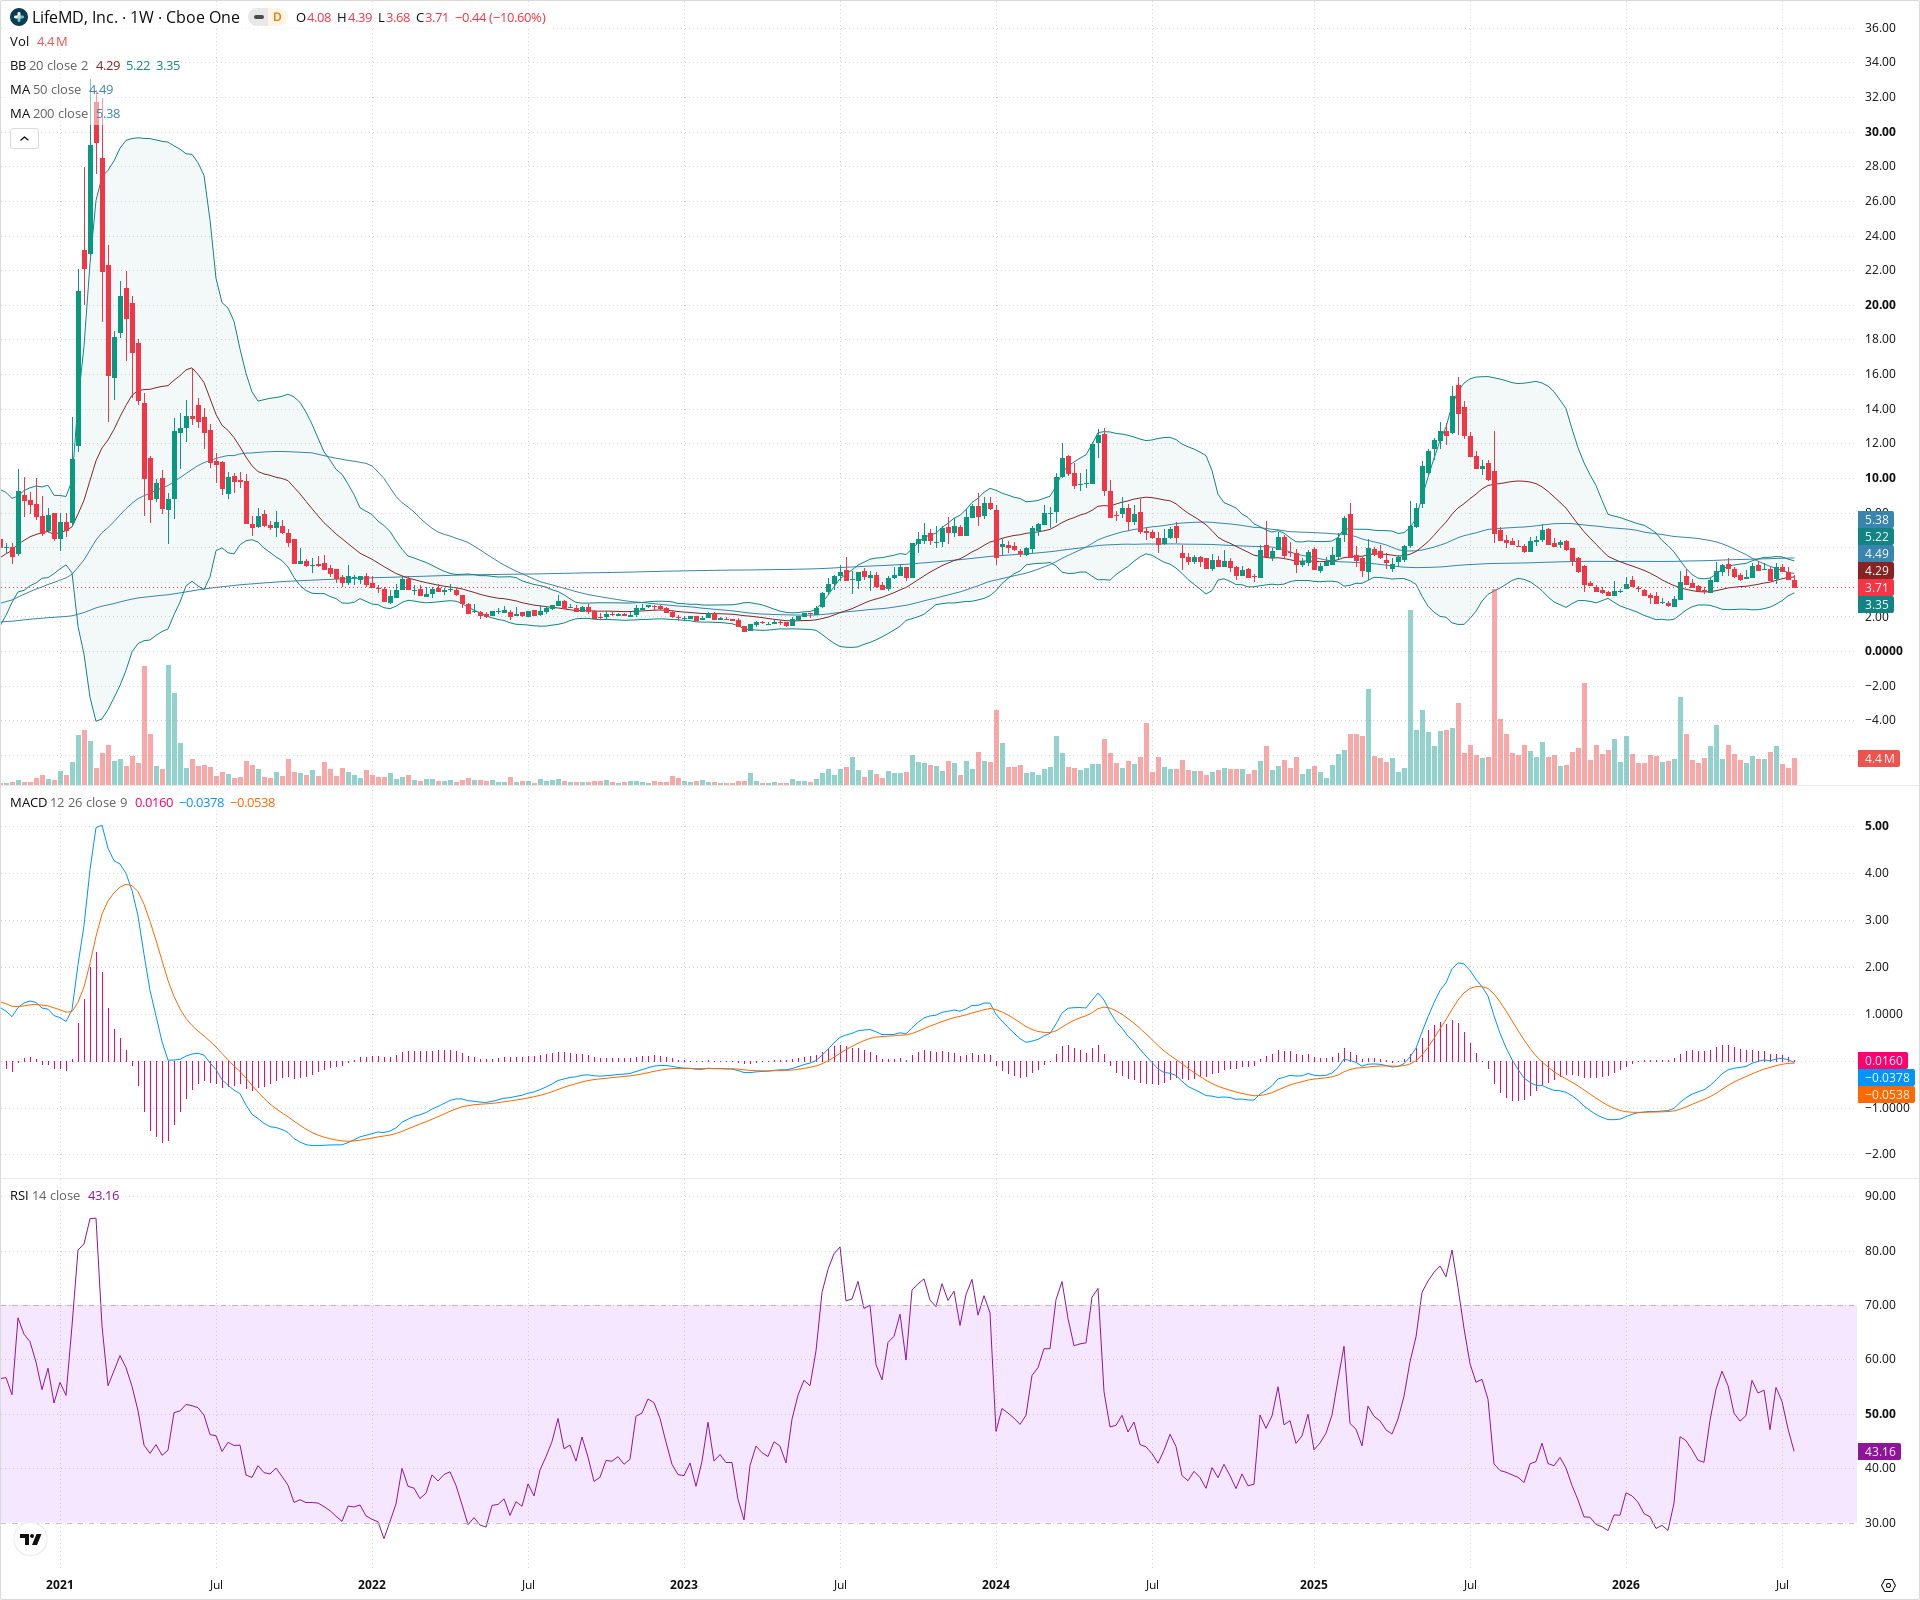
LFMD Weekly Chart
Sentiment
Short-term Sentiment (days to weeks): Bearish
Price is locked in a steep sequence of lower highs and lower lows, hugging the lower Bollinger Band. The weekly MACD is deep in negative territory with a widening histogram, and RSI is trending downwards below 50, indicating strong downward momentum.
Long-term Sentiment (weeks to months): Bearish
The stock has decisively broken down from a massive multi-month topping pattern. Price is currently trading well below a declining 50-week SMA, which recently crossed below the 200-week SMA, establishing a firmly negative long-term trend.
Report Metadata
- Timeframe: weekly
- Generated at: 2026-07-25T09:12:51.199Z
- Model: gemini-3.1-pro-preview
Support Price Levels
| Level | Range | Strength | Notes |
|---|---|---|---|
| $3.25 | $3.00 - $3.50 | Weak | Minor consolidation zone from mid-2023 before the primary rally began. |
| $1.75 | $1.50 - $2.00 | Strong | Major structural multi-year bottom established during late 2022 and early 2023. |
Resistance Price Levels
| Level | Range | Strength | Notes |
|---|---|---|---|
| $4.35 | $4.20 - $4.50 | Strong | Immediate heavy overhead resistance formed by the declining 20-week and 50-week SMAs. |
| $5.65 | $5.30 - $6.00 | Strong | Confluence of the 200-week SMA and the breakdown zone from the previous large structural base. |
Potential Chart Patterns in Formation
| Strength | Pattern | Signal | Target | Details |
|---|---|---|---|---|
| Strong | Head and Shoulders Top | Bearish | N/A | A massive, multi-month topping pattern formed between late 2023 and late 2024, peaking near 15. The price has decisively broken the neckline support in the 6-7 range, triggering a major long-term trend reversal to the downside. |
Frequently Asked Questions about LFMD
What is the current sentiment for LFMD?
The short-term sentiment for LFMD is currently Bearish because Price is locked in a steep sequence of lower highs and lower lows, hugging the lower Bollinger Band. The weekly MACD is deep in negative territory with a widening histogram, and RSI is trending downwards below 50, indicating strong downward momentum.. The long-term trend is classified as Bearish.
What are the key support levels for LFMD?
StockDips.AI has identified key support levels for LFMD at $3.25 and $1.75. These levels may represent potential accumulation zones where buying interest could emerge.
Is LFMD in a significant dip or a Value Dip right now?
LFMD has a Value Score of 40/100. It is not currently flagged as a significant dip in the Top Dips list. It is not listed as a Value Dip because the long-term sentiment or value-score threshold does not qualify.
View the full interactive analysis on StockDips.AI.