RKLB Daily Technical Analysis
Rocket Lab Corp
Aerospace company that provides an end-to-end space solutions platform, which includes designing, manufacturing, launching, and operating rockets and satellites for commercial, government, and defense customers.
RKLB Technical Analysis Summary
RKLB is exhibiting a heavily bearish technical posture across both short and long-term timeframes following the breakdown of a massive Head and Shoulders top. The stock has plummeted through major moving averages, triggering a death cross and showing accelerating downside momentum confirmed by MACD. While RSI is nearing oversold territory, the sheer strength of the downtrend suggests caution until structural support in the 40-45 zone is tested or reversal patterns emerge.
Included In Lists
Related Tickers of Interest
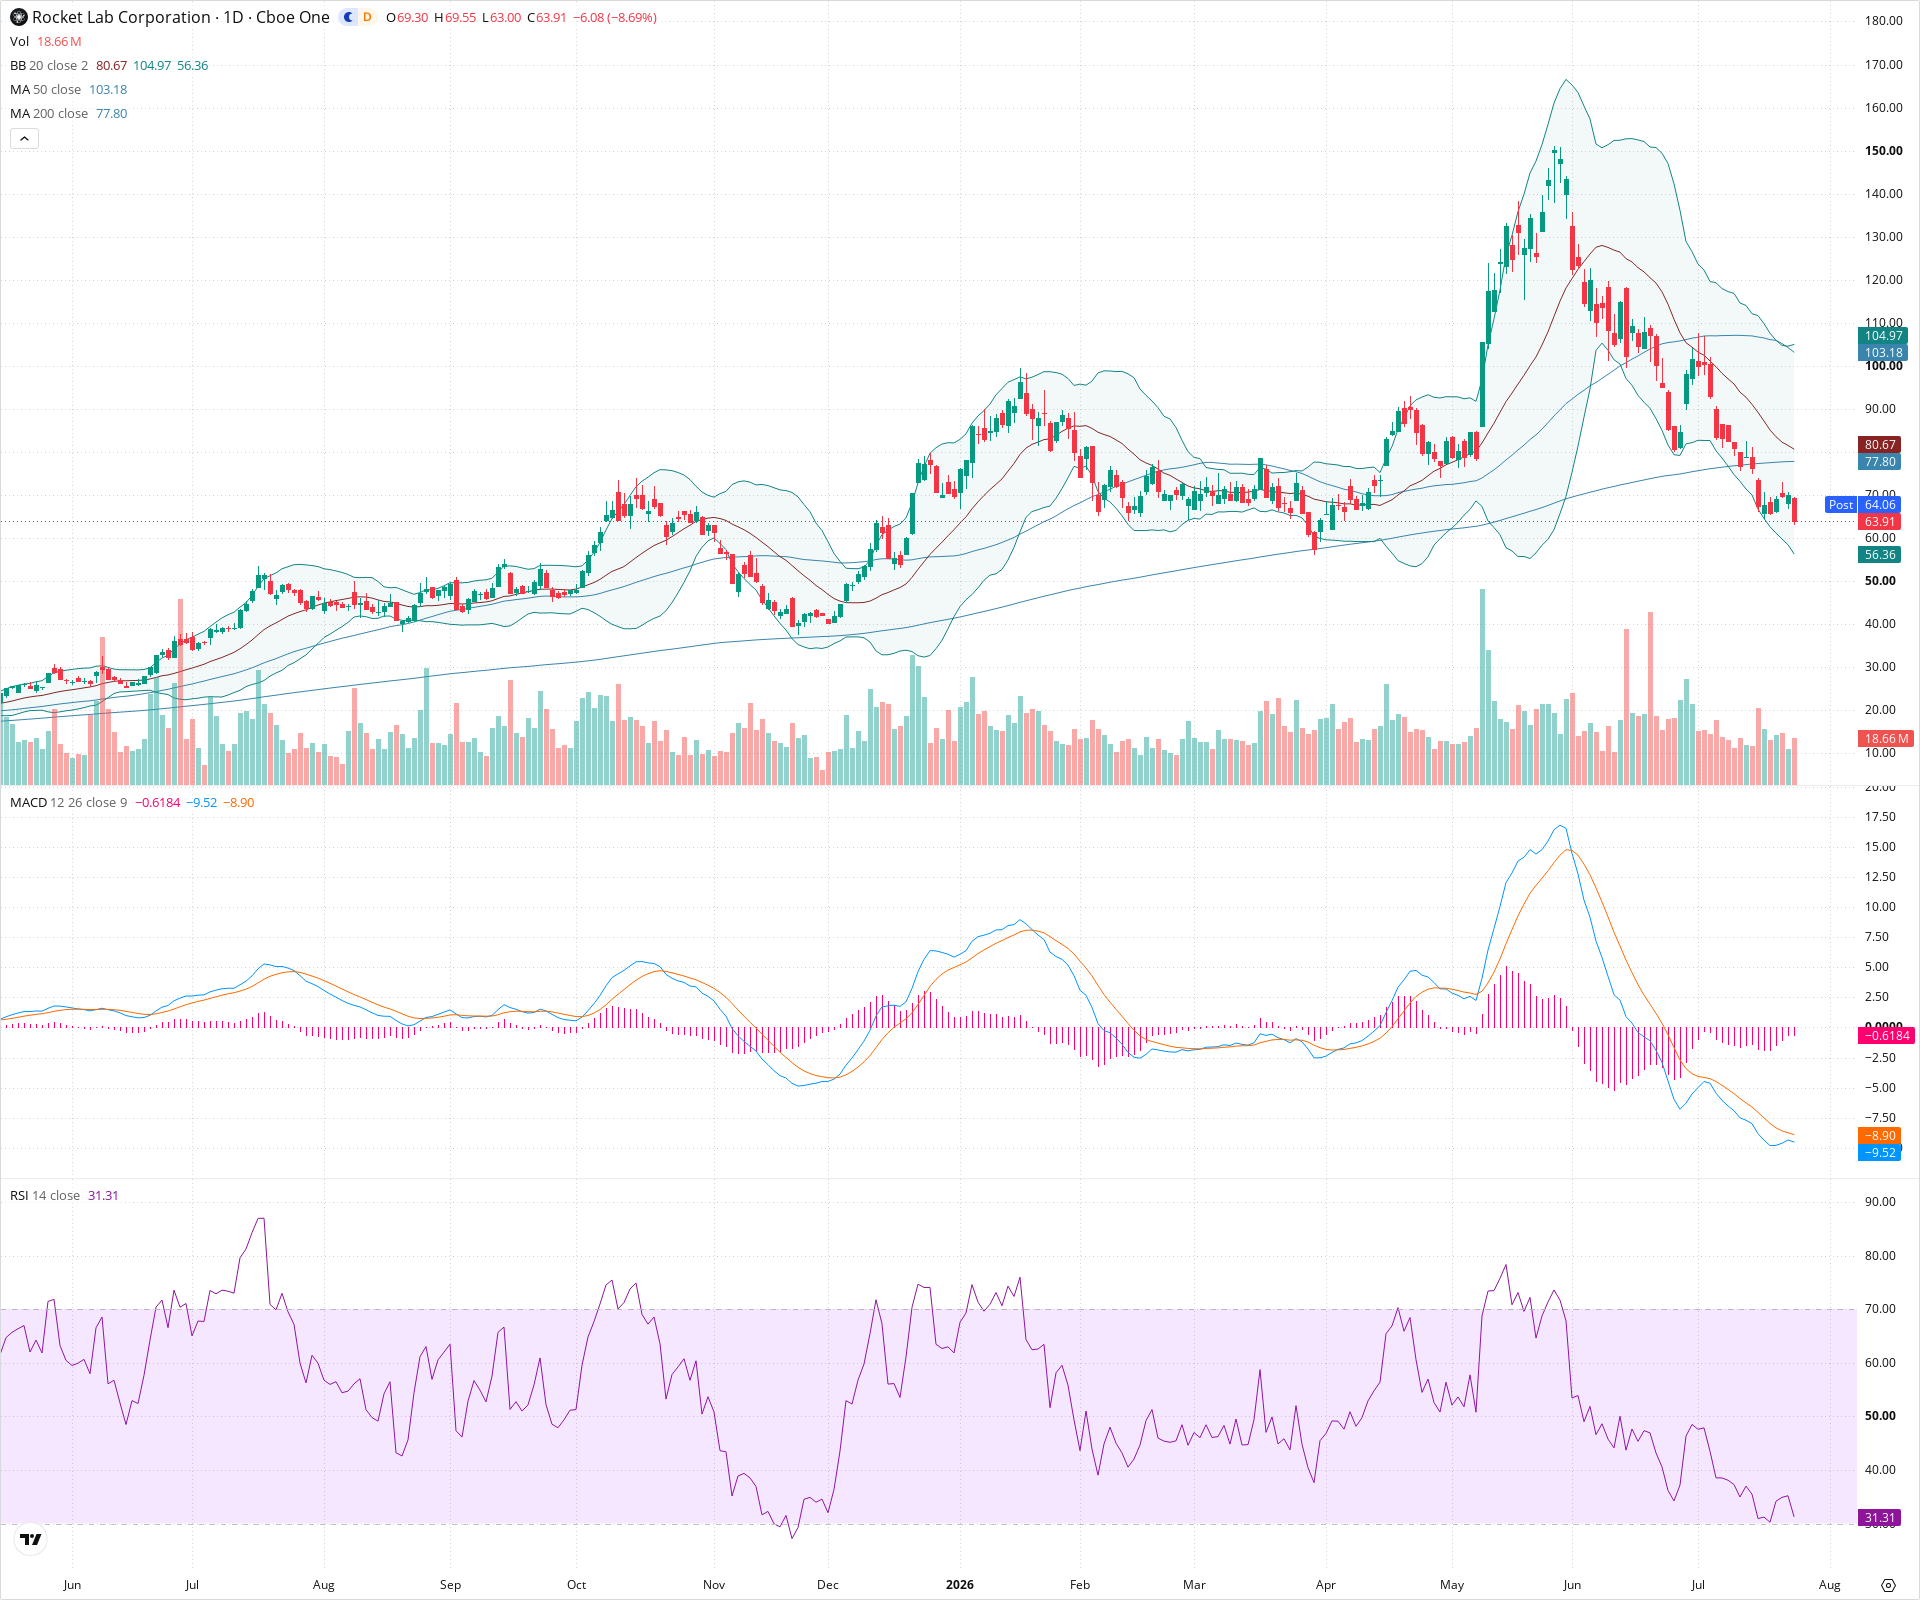
RKLB Daily Chart
Sentiment
Short-term Sentiment (days to weeks): Bearish
Price is in a steep downtrend, making lower lows and lower highs while riding the lower Bollinger Band. MACD shows expanding negative momentum, and the most recent candle is a large bearish engulfing bar on above-average volume.
Long-term Sentiment (weeks to months): Bearish
A massive Head and Shoulders top pattern has broken down. Price has sliced through the 200-day SMA, which is beginning to flatten, and a bearish 'death cross' (50-day crossing below 200-day SMA) has occurred, signaling a major trend reversal.
Report Metadata
- Timeframe: daily
- Generated at: 2026-07-24T21:16:45.002Z
- Model: gemini-3.1-pro-preview
Support Price Levels
| Level | Range | Strength | Notes |
|---|---|---|---|
| $57.50 | $55.00 - $60.00 | Weak | Immediate downside area based on historical consolidation from early in the year, prior to the major rally. |
| $42.50 | $40.00 - $45.00 | Strong | Major structural base and swing low established before the massive uptrend began; this is the most significant historical support visible. |
Resistance Price Levels
| Level | Range | Strength | Notes |
|---|---|---|---|
| $77.50 | $75.00 - $80.00 | Strong | Confluence zone of previous support turned resistance, housing the 200-day SMA and the steeply declining 20-day SMA. |
| $102.50 | $100.00 - $105.00 | Strong | The broken neckline area of the Head and Shoulders top pattern, now coinciding with the declining 50-day SMA. |
Potential Chart Patterns in Formation
| Strength | Pattern | Signal | Target | Details |
|---|---|---|---|---|
| Strong | Head and Shoulders Top | Bearish | N/A | A very large, prominent topping formation with a left shoulder around 130, head near 170, and right shoulder near 140. The neckline breakdown near 100-110 catalyzed the current steep downtrend. |
| Strong | Death Cross | Bearish | N/A | The 50-day Simple Moving Average has crossed below the 200-day Simple Moving Average, confirming a long-term shift in trend momentum to the downside. |
Frequently Asked Questions about RKLB
What is the current sentiment for RKLB?
The short-term sentiment for RKLB is currently Bearish because Price is in a steep downtrend, making lower lows and lower highs while riding the lower Bollinger Band. MACD shows expanding negative momentum, and the most recent candle is a large bearish engulfing bar on above-average volume.. The long-term trend is classified as Bearish.
What are the key support levels for RKLB?
StockDips.AI has identified key support levels for RKLB at $57.50 and $42.50. These levels may represent potential accumulation zones where buying interest could emerge.
Is RKLB in a significant dip or a Value Dip right now?
RKLB has a Value Score of 68/100. It is not currently flagged as a significant dip in the Top Dips list. It is not listed as a Value Dip because the long-term sentiment or value-score threshold does not qualify.
View the full interactive analysis on StockDips.AI.