UNH Weekly Technical Analysis
UnitedHealth Group Inc
Health insurance and services company operating UnitedHealthcare and Optum divisions.
UNH Technical Analysis Summary
UNH has experienced a substantial multi-month recovery from deep lows, establishing a clear uptrend supported by rising shorter-term moving averages. However, the rally recently met significant resistance at the 200-week SMA, resulting in a short-term pullback. Long-term investors should watch for a decisive breakout above the 460-480 zone to signal a full trend reversal, while near-term support sits around the 366 level.
Included In Lists
Related Tickers of Interest
UNH Weekly Chart
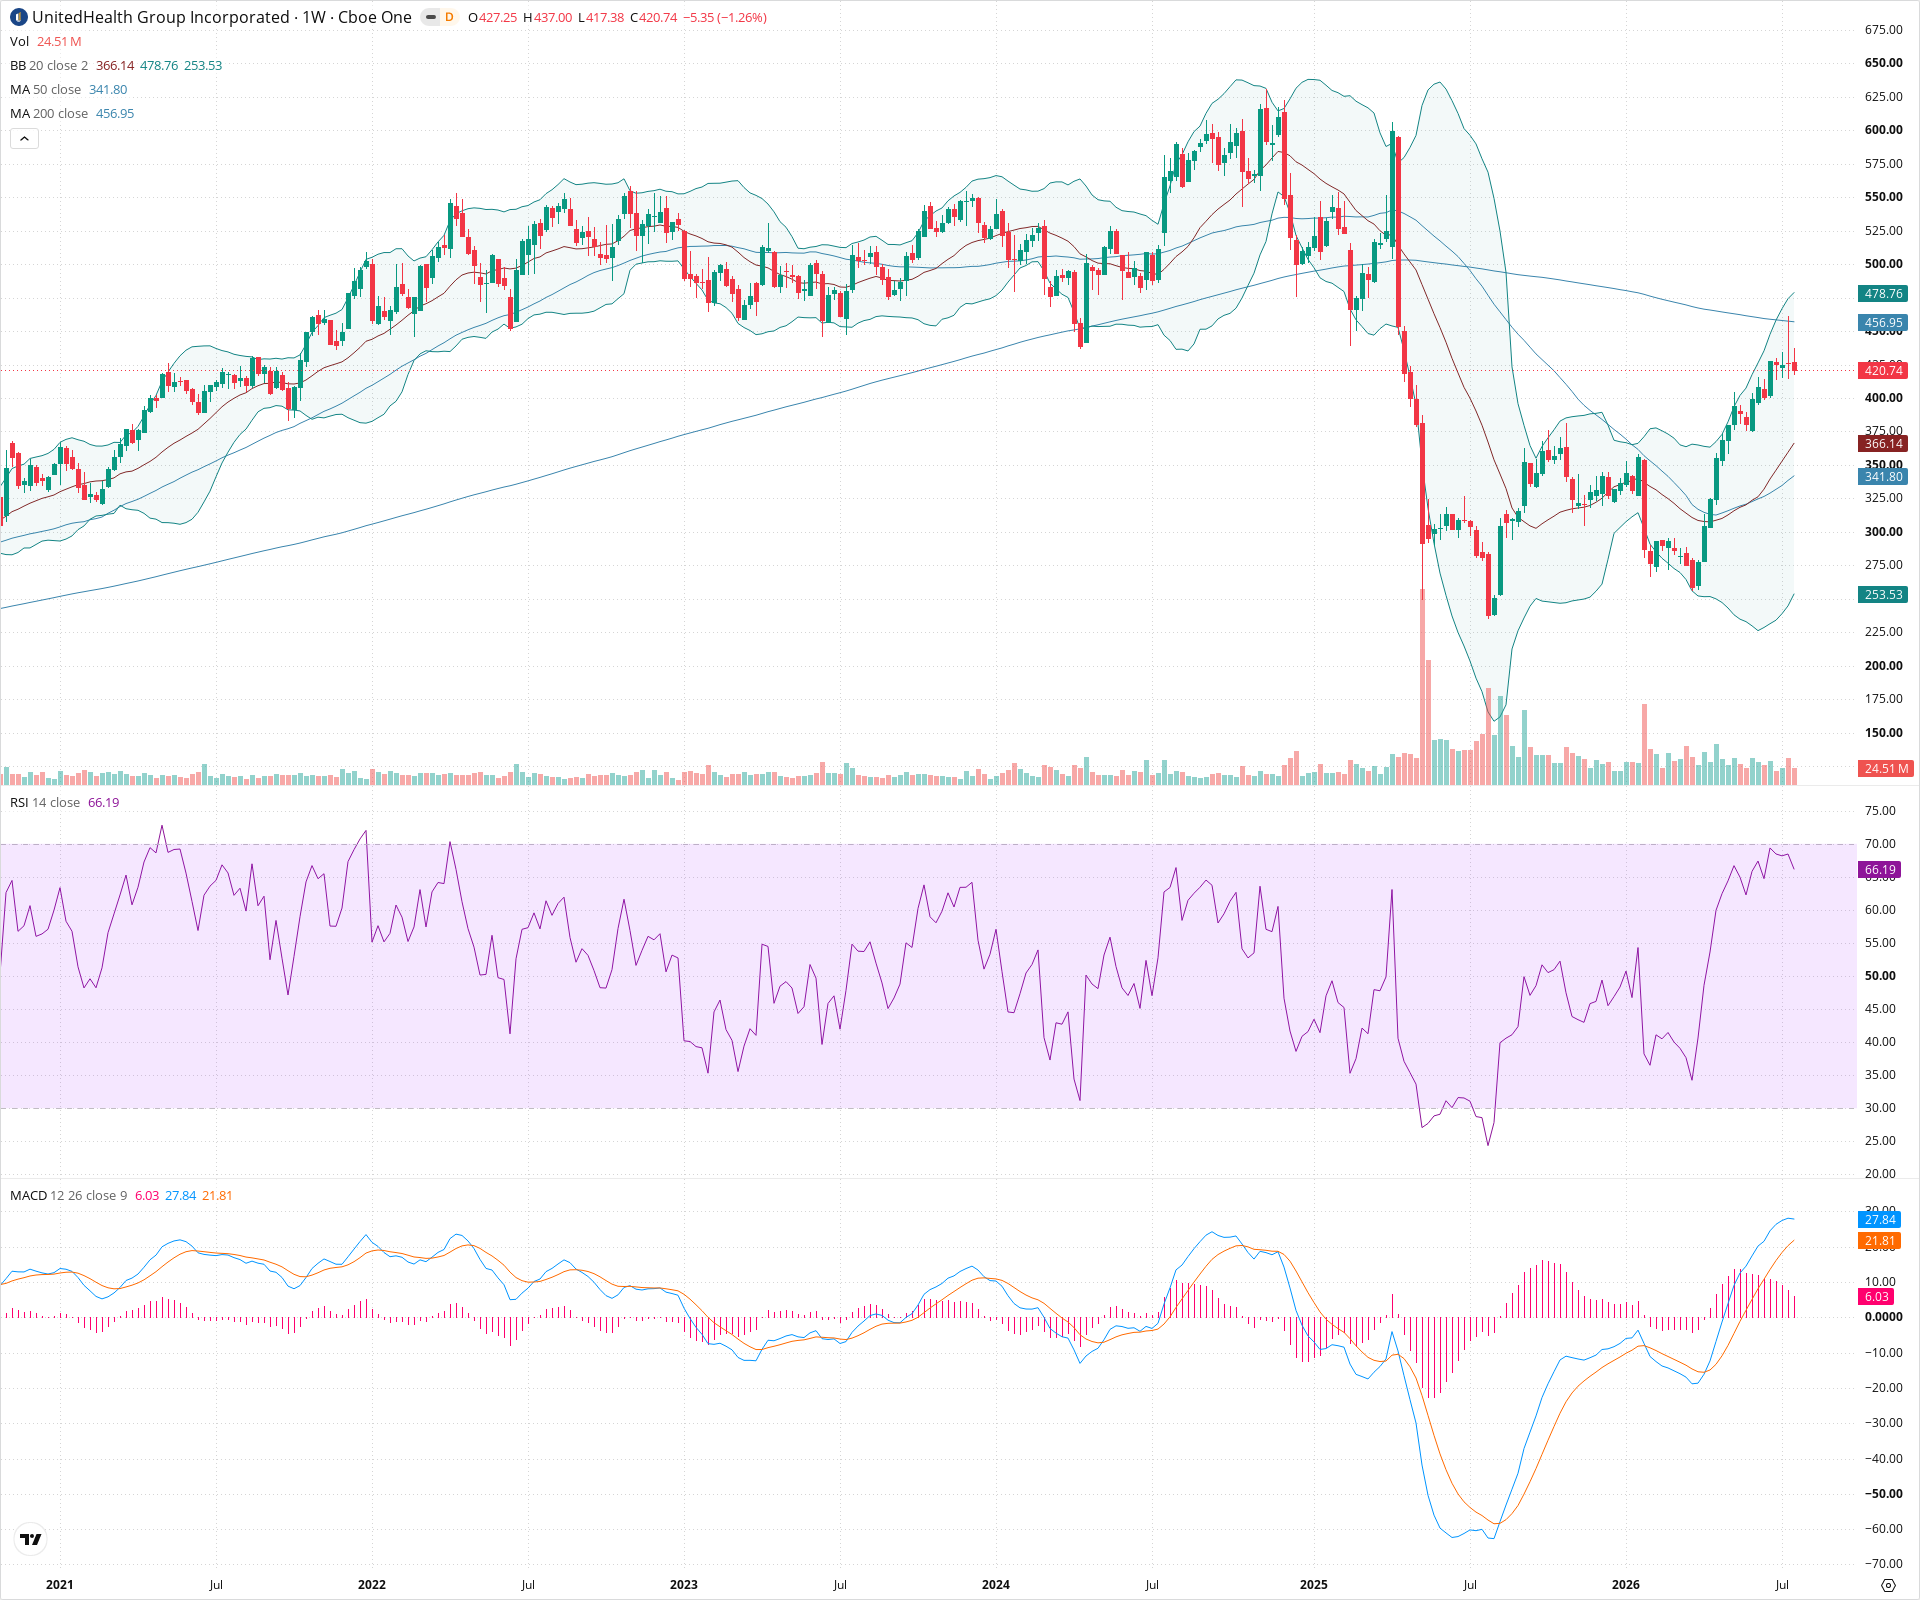
Sentiment
Short-term Sentiment (days to weeks): Bearish
Price is pulling back after rejecting off the 200-week SMA and upper Bollinger Band. RSI is declining from near-overbought levels, and the MACD histogram is shrinking, indicating a loss of upward momentum.
Long-term Sentiment (weeks to months): Neutral
The stock is in a strong recovery uptrend from major lows and holds above the rising 20-week and 50-week SMAs. However, it remains below the long-term 200-week SMA, which must be overcome to confirm a full bullish reversal.
Report Metadata
- Timeframe: weekly
- Generated at: 2026-07-25T09:04:41.194Z
- Model: gemini-3.1-pro-preview
Support Price Levels
| Level | Range | Strength | Notes |
|---|---|---|---|
| $400.00 | $390.00 - $410.00 | Weak | Immediate structural support from minor consolidation areas on the way up. |
| $353.00 | $340.00 - $366.00 | Strong | Confluence zone of the rising 20-week SMA (366.14) and 50-week SMA (341.80). |
Resistance Price Levels
| Level | Range | Strength | Notes |
|---|---|---|---|
| $467.50 | $455.00 - $480.00 | Strong | Major resistance zone encompassing the 200-week SMA (456.95) and the recent swing highs. |
| $537.50 | $525.00 - $550.00 | Strong | Historical structural resistance zone from price action prior to the major sell-off. |
Potential Chart Patterns in Formation
| Strength | Pattern | Signal | Target | Details |
|---|---|---|---|---|
| Strong | Rejection at 200-week SMA | Bearish | N/A | The recent rally stalled exactly at the 200-week moving average, initiating the current pullback. |
| Strong | Recovery Uptrend | Bullish | N/A | Since bottoming around 250, the stock has established a clear pattern of higher highs and higher lows, guided higher by the 20-week SMA. |
Frequently Asked Questions about UNH
What is the current sentiment for UNH?
The short-term sentiment for UNH is currently Bearish because Price is pulling back after rejecting off the 200-week SMA and upper Bollinger Band. RSI is declining from near-overbought levels, and the MACD histogram is shrinking, indicating a loss of upward momentum.. The long-term trend is classified as Neutral.
What are the key support levels for UNH?
StockDips.AI has identified key support levels for UNH at $400.00 and $353.00. These levels may represent potential accumulation zones where buying interest could emerge.
Is UNH in a significant dip or a Value Dip right now?
UNH has a Value Score of 57/100. It is not currently flagged as a significant dip in the Top Dips list. It is not listed as a Value Dip because the long-term sentiment or value-score threshold does not qualify.
View the full interactive analysis on StockDips.AI.