AMC Weekly Technical Analysis
AMC Entertainment Holdings, Inc.
Largest U.S. movie-theater chain, widely known as a high-volatility meme stock with strong retail trader attention.
AMC Technical Analysis Summary
AMC is in the late stages of a massive multi-year collapse, currently exhibiting 'penny stock' behavior by flatlining near its absolute lows. While a long-term base appears to be forming as downward momentum has ceased, the stock remains deeply entrenched in a macro downtrend far below its 200-week moving average. Short-term price action is completely sideways and trendless, requiring a significant breakout above the 3.00 level on heavy volume to suggest any meaningful reversal.
Included In Lists
Related Tickers of Interest
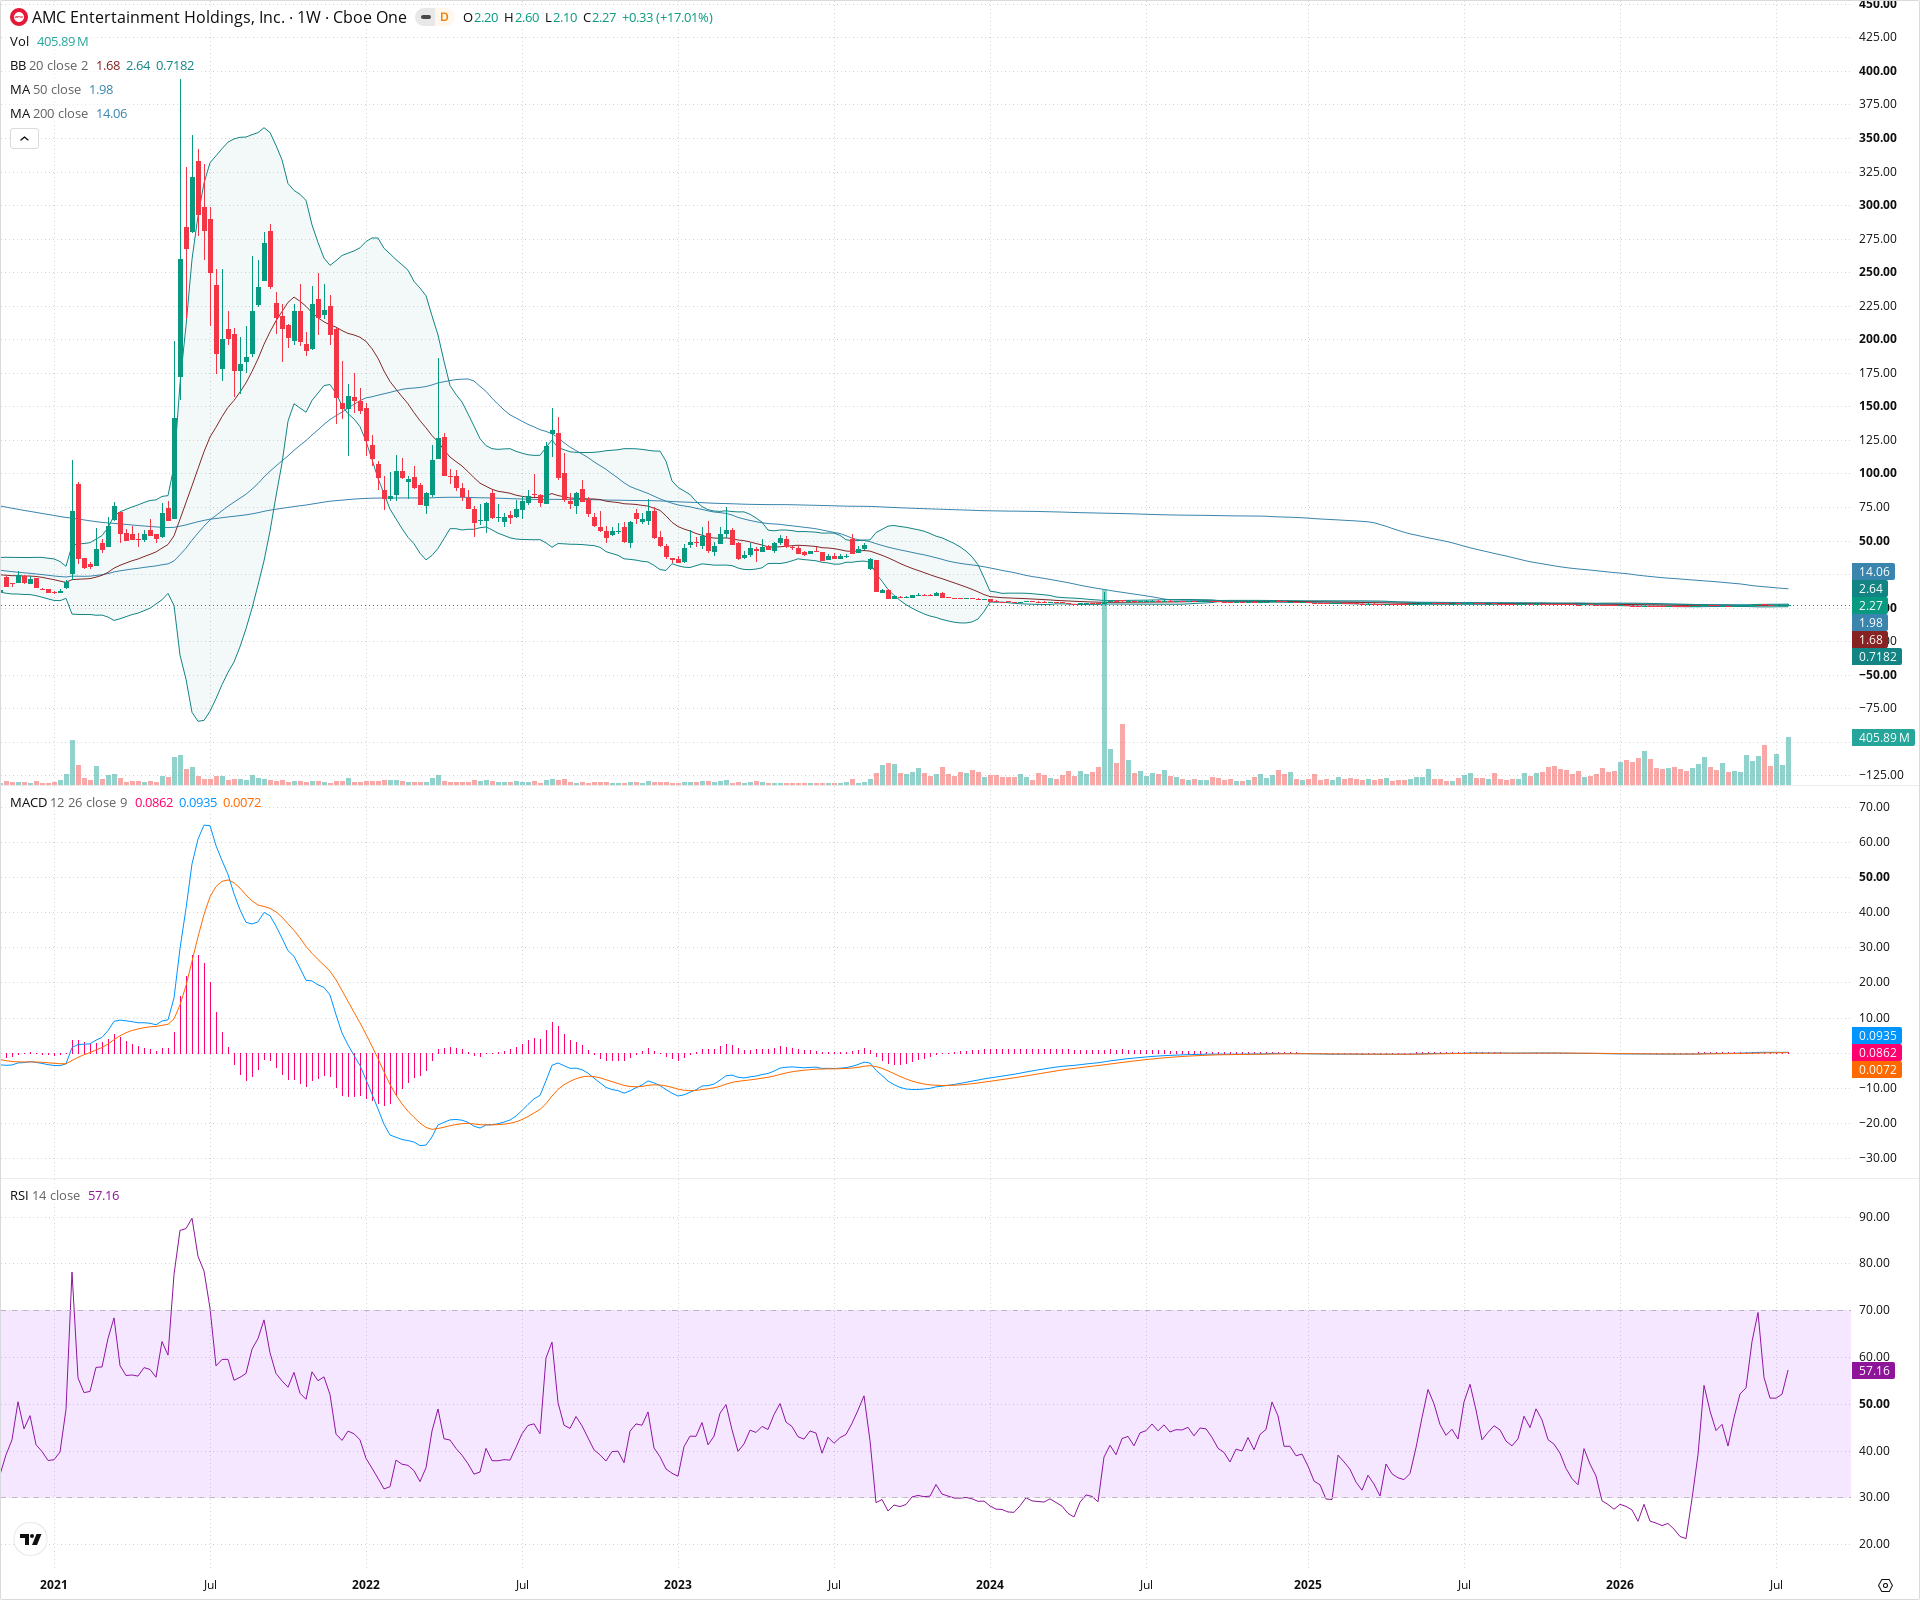
AMC Weekly Chart
Sentiment
Short-term Sentiment (days to weeks): Neutral
Price is trading in a very tight sideways consolidation range, sandwiched between the 50-week and 20-week SMAs. RSI is neutral around 57, and MACD is completely flat near the zero line, indicating a lack of near-term directional momentum.
Long-term Sentiment (weeks to months): Bearish
The long-term chart shows a massive, catastrophic decline from 2021 highs. The price remains heavily suppressed and trades far below the declining 200-week SMA, confirming a dominant long-term downtrend despite the recent sideways action.
Report Metadata
- Timeframe: weekly
- Generated at: 2026-07-25T09:12:08.399Z
- Model: gemini-3.1-pro-preview
Support Price Levels
| Level | Range | Strength | Notes |
|---|---|---|---|
| $1.80 | $1.60 - $2.00 | Strong | Current base support zone encompassing recent swing lows and the slightly rising 50-week SMA (1.98). |
Resistance Price Levels
| Level | Range | Strength | Notes |
|---|---|---|---|
| $2.80 | $2.60 - $3.00 | Strong | Near-term resistance defined by the 20-week SMA (2.64) and recent consolidation highs. |
| $7.00 | $6.00 - $8.00 | Weak | Previous structural breakdown zone from early 2023, far above current price action. |
| $14.00 | $13.50 - $14.50 | Strong | Major long-term resistance defined by the steeply declining 200-week SMA (14.06). |
Potential Chart Patterns in Formation
| Strength | Pattern | Signal | Target | Details |
|---|---|---|---|---|
| Weak | Base Formation / Sideways Consolidation | Neutral | N/A | After a massive multi-year downtrend, the price has flatlined at the bottom of the chart, trading sideways in a very tight range for an extended period. |
Frequently Asked Questions about AMC
What is the current sentiment for AMC?
The short-term sentiment for AMC is currently Neutral because Price is trading in a very tight sideways consolidation range, sandwiched between the 50-week and 20-week SMAs. RSI is neutral around 57, and MACD is completely flat near the zero line, indicating a lack of near-term directional momentum.. The long-term trend is classified as Bearish.
What are the key support levels for AMC?
StockDips.AI has identified key support levels for AMC at $1.80. These levels may represent potential accumulation zones where buying interest could emerge.
Is AMC in a significant dip or a Value Dip right now?
AMC has a Value Score of 40/100. It is not currently flagged as a significant dip in the Top Dips list. It is not listed as a Value Dip because the long-term sentiment or value-score threshold does not qualify.
View the full interactive analysis on StockDips.AI.