DNUT Daily Technical Analysis
Krispy Kreme, Inc.
Iconic doughnut and baked-goods brand with global distribution through stores, retailers, and fresh-daily delivery hubs.
DNUT Technical Analysis Summary
The technical picture for DNUT is heavily bearish across multiple timeframes. A relentless long-term downtrend remains intact, defined by price action consistently below declining major moving averages (20, 50, 200). Recent attempts to base have failed, resulting in a breakdown confirmed by negative MACD momentum, suggesting a high probability of continued downward pressure toward major support near 2.50 unless overhead resistance at the 3.50 level is decisively reclaimed.
Included In Lists
Related Tickers of Interest
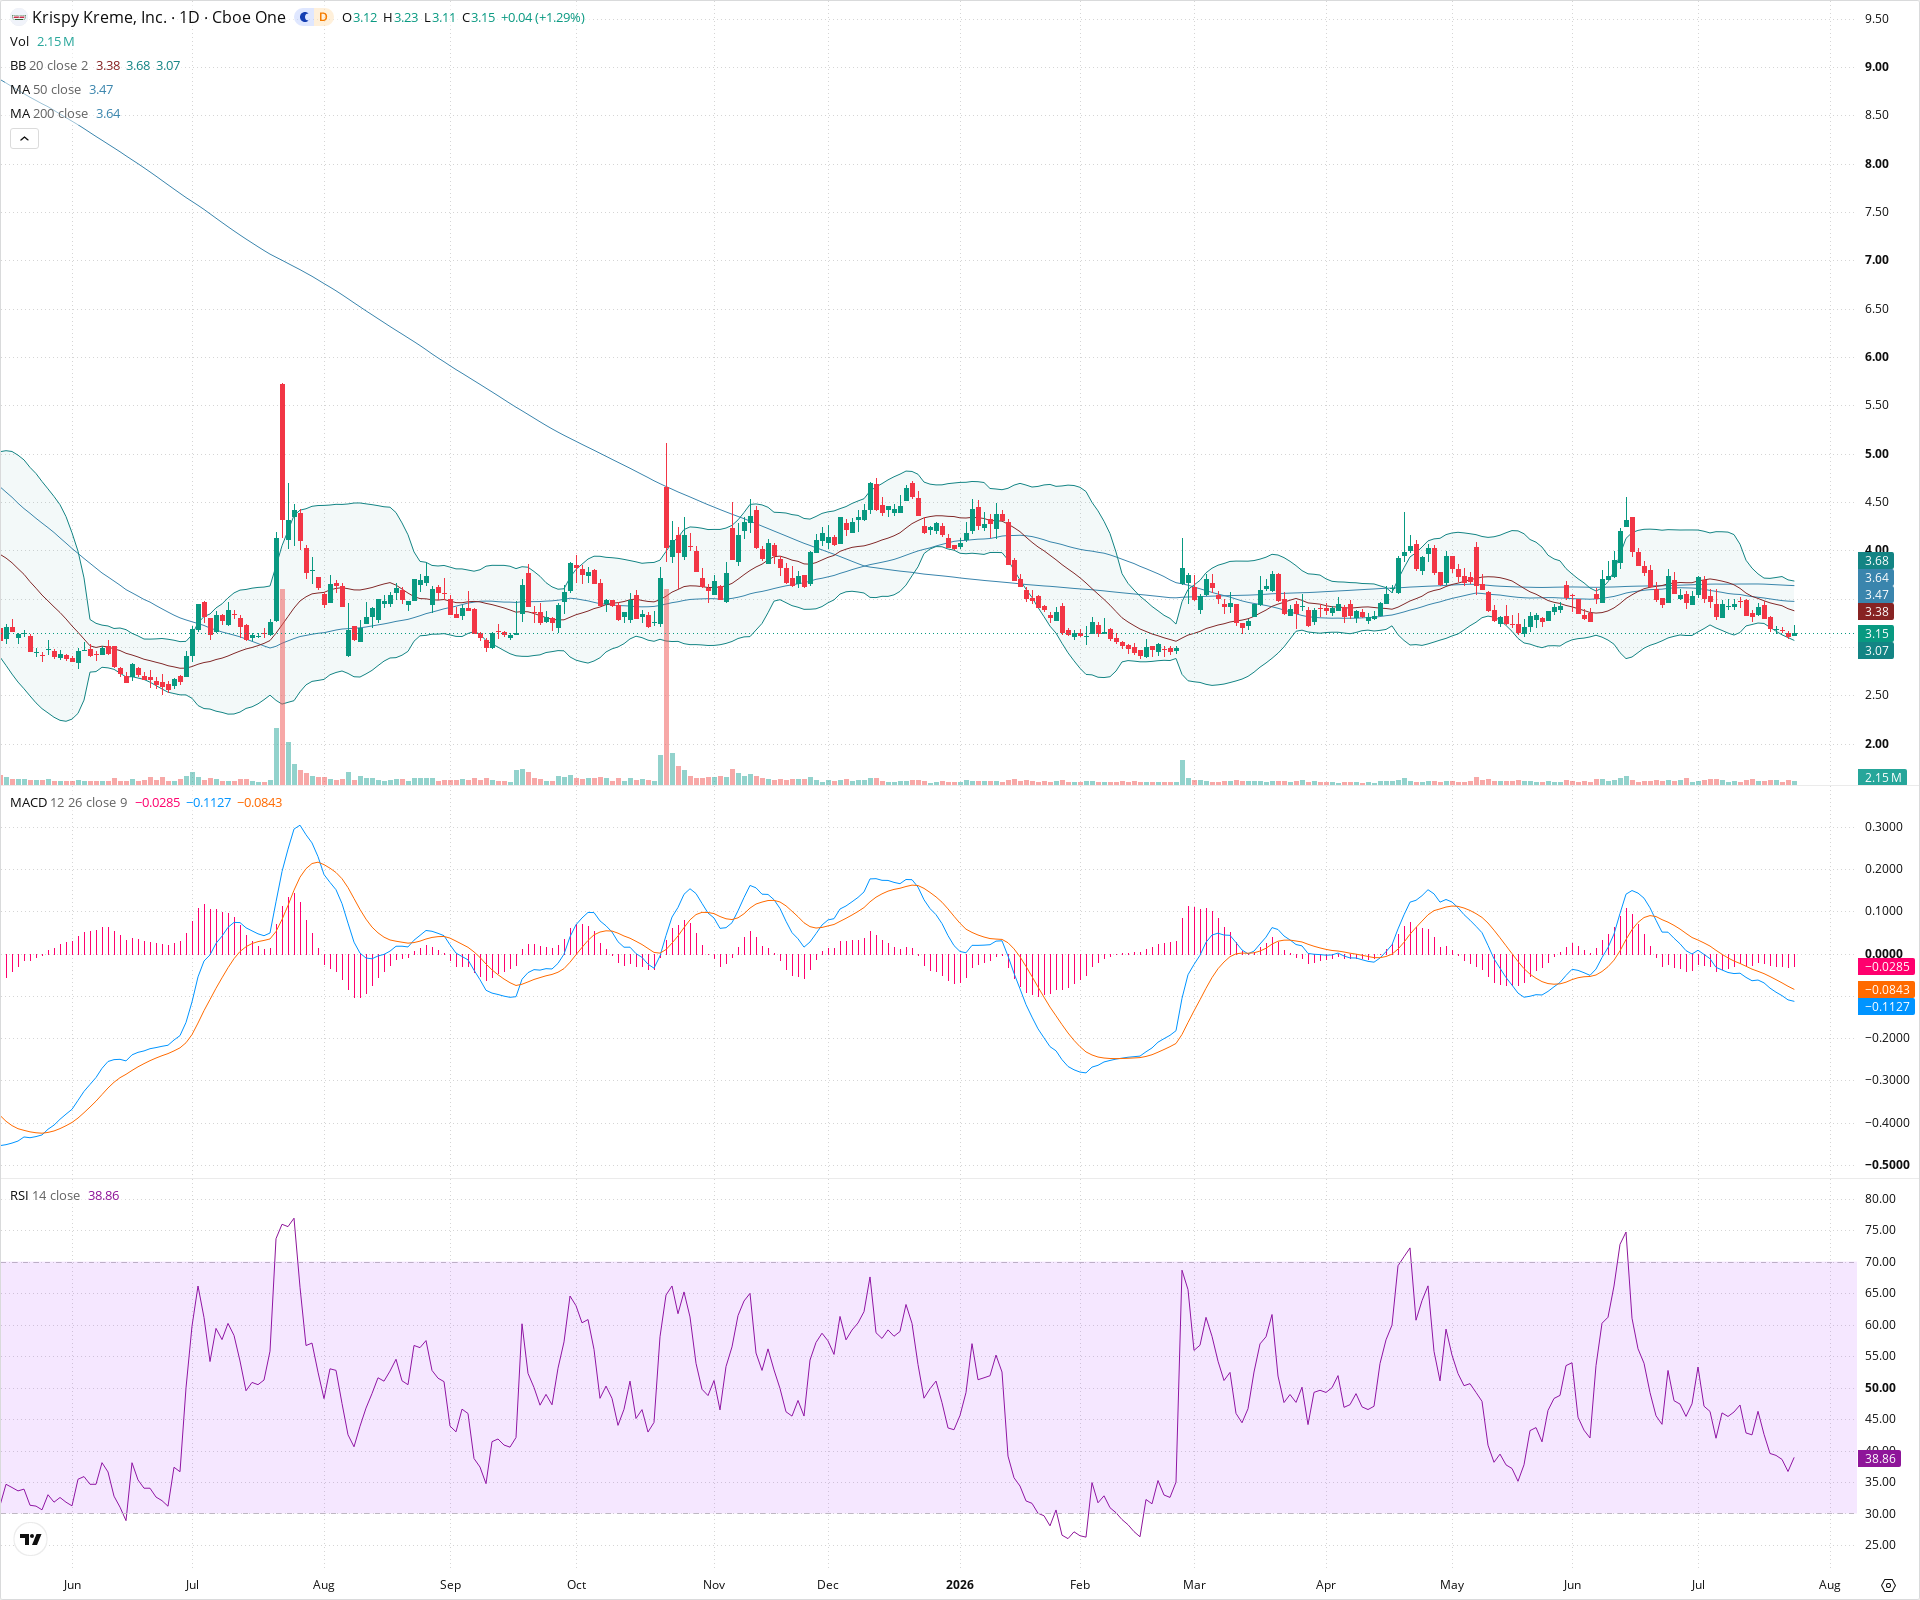
DNUT Daily Chart
Sentiment
Short-term Sentiment (days to weeks): Bearish
Price recently broke below the 20 and 50-day SMAs, making new local lows. MACD shows a bearish crossover with an expanding negative histogram, and RSI is declining towards oversold territory, indicating increasing downward momentum.
Long-term Sentiment (weeks to months): Bearish
The chart exhibits a persistent, long-term downtrend characterized by lower highs and lower lows. Price remains trapped below a declining 200-day SMA, with the 20, 50, and 200 SMAs in a bearish alignment.
Report Metadata
- Timeframe: daily
- Generated at: 2026-07-24T21:06:10.599Z
- Model: gemini-3.1-pro-preview
Support Price Levels
| Level | Range | Strength | Notes |
|---|---|---|---|
| $3.05 | $3.00 - $3.10 | Weak | Immediate support zone near the lower Bollinger Band and psychological round number. A minor bounce occurred near here recently. |
| $2.58 | $2.50 - $2.65 | Strong | Major swing low established around February. This represents the lowest visible point on the chart and acts as critical structural support. |
Resistance Price Levels
| Level | Range | Strength | Notes |
|---|---|---|---|
| $3.43 | $3.35 - $3.50 | Strong | Immediate overhead resistance zone containing the declining 20-day and 50-day SMAs, as well as the recent breakdown level from prior consolidation. |
| $3.70 | $3.60 - $3.80 | Strong | Significant resistance zone encompassing the 200-day SMA and prior swing highs from June/July. |
| $4.60 | $4.50 - $4.70 | Strong | Major structural swing high from late November/early December. |
Potential Chart Patterns in Formation
| Strength | Pattern | Signal | Target | Details |
|---|---|---|---|---|
| Strong | Long-term Downtrend | Bearish | N/A | A persistent pattern of lower highs and lower lows spanning the entire visible chart, with price consistently rejected by the 200-day SMA. |
| Strong | Consolidation Breakdown | Bearish | N/A | Price recently failed to hold a multi-month consolidation range between roughly 3.40 and 4.00, breaking below near-term moving averages and signaling trend continuation. |
Frequently Asked Questions about DNUT
What is the current sentiment for DNUT?
The short-term sentiment for DNUT is currently Bearish because Price recently broke below the 20 and 50-day SMAs, making new local lows. MACD shows a bearish crossover with an expanding negative histogram, and RSI is declining towards oversold territory, indicating increasing downward momentum.. The long-term trend is classified as Bearish.
What are the key support levels for DNUT?
StockDips.AI has identified key support levels for DNUT at $3.05 and $2.58. These levels may represent potential accumulation zones where buying interest could emerge.
Is DNUT in a significant dip or a Value Dip right now?
DNUT has a Value Score of 73/100. It is currently flagged as a significant dip in the Top Dips list. It is not listed as a Value Dip because the long-term sentiment or value-score threshold does not qualify.
View the full interactive analysis on StockDips.AI.