AMZN Daily Technical Analysis
Amazon.com Inc.
Global e-commerce leader with major cloud services via Amazon Web Services.
AMZN Technical Analysis Summary
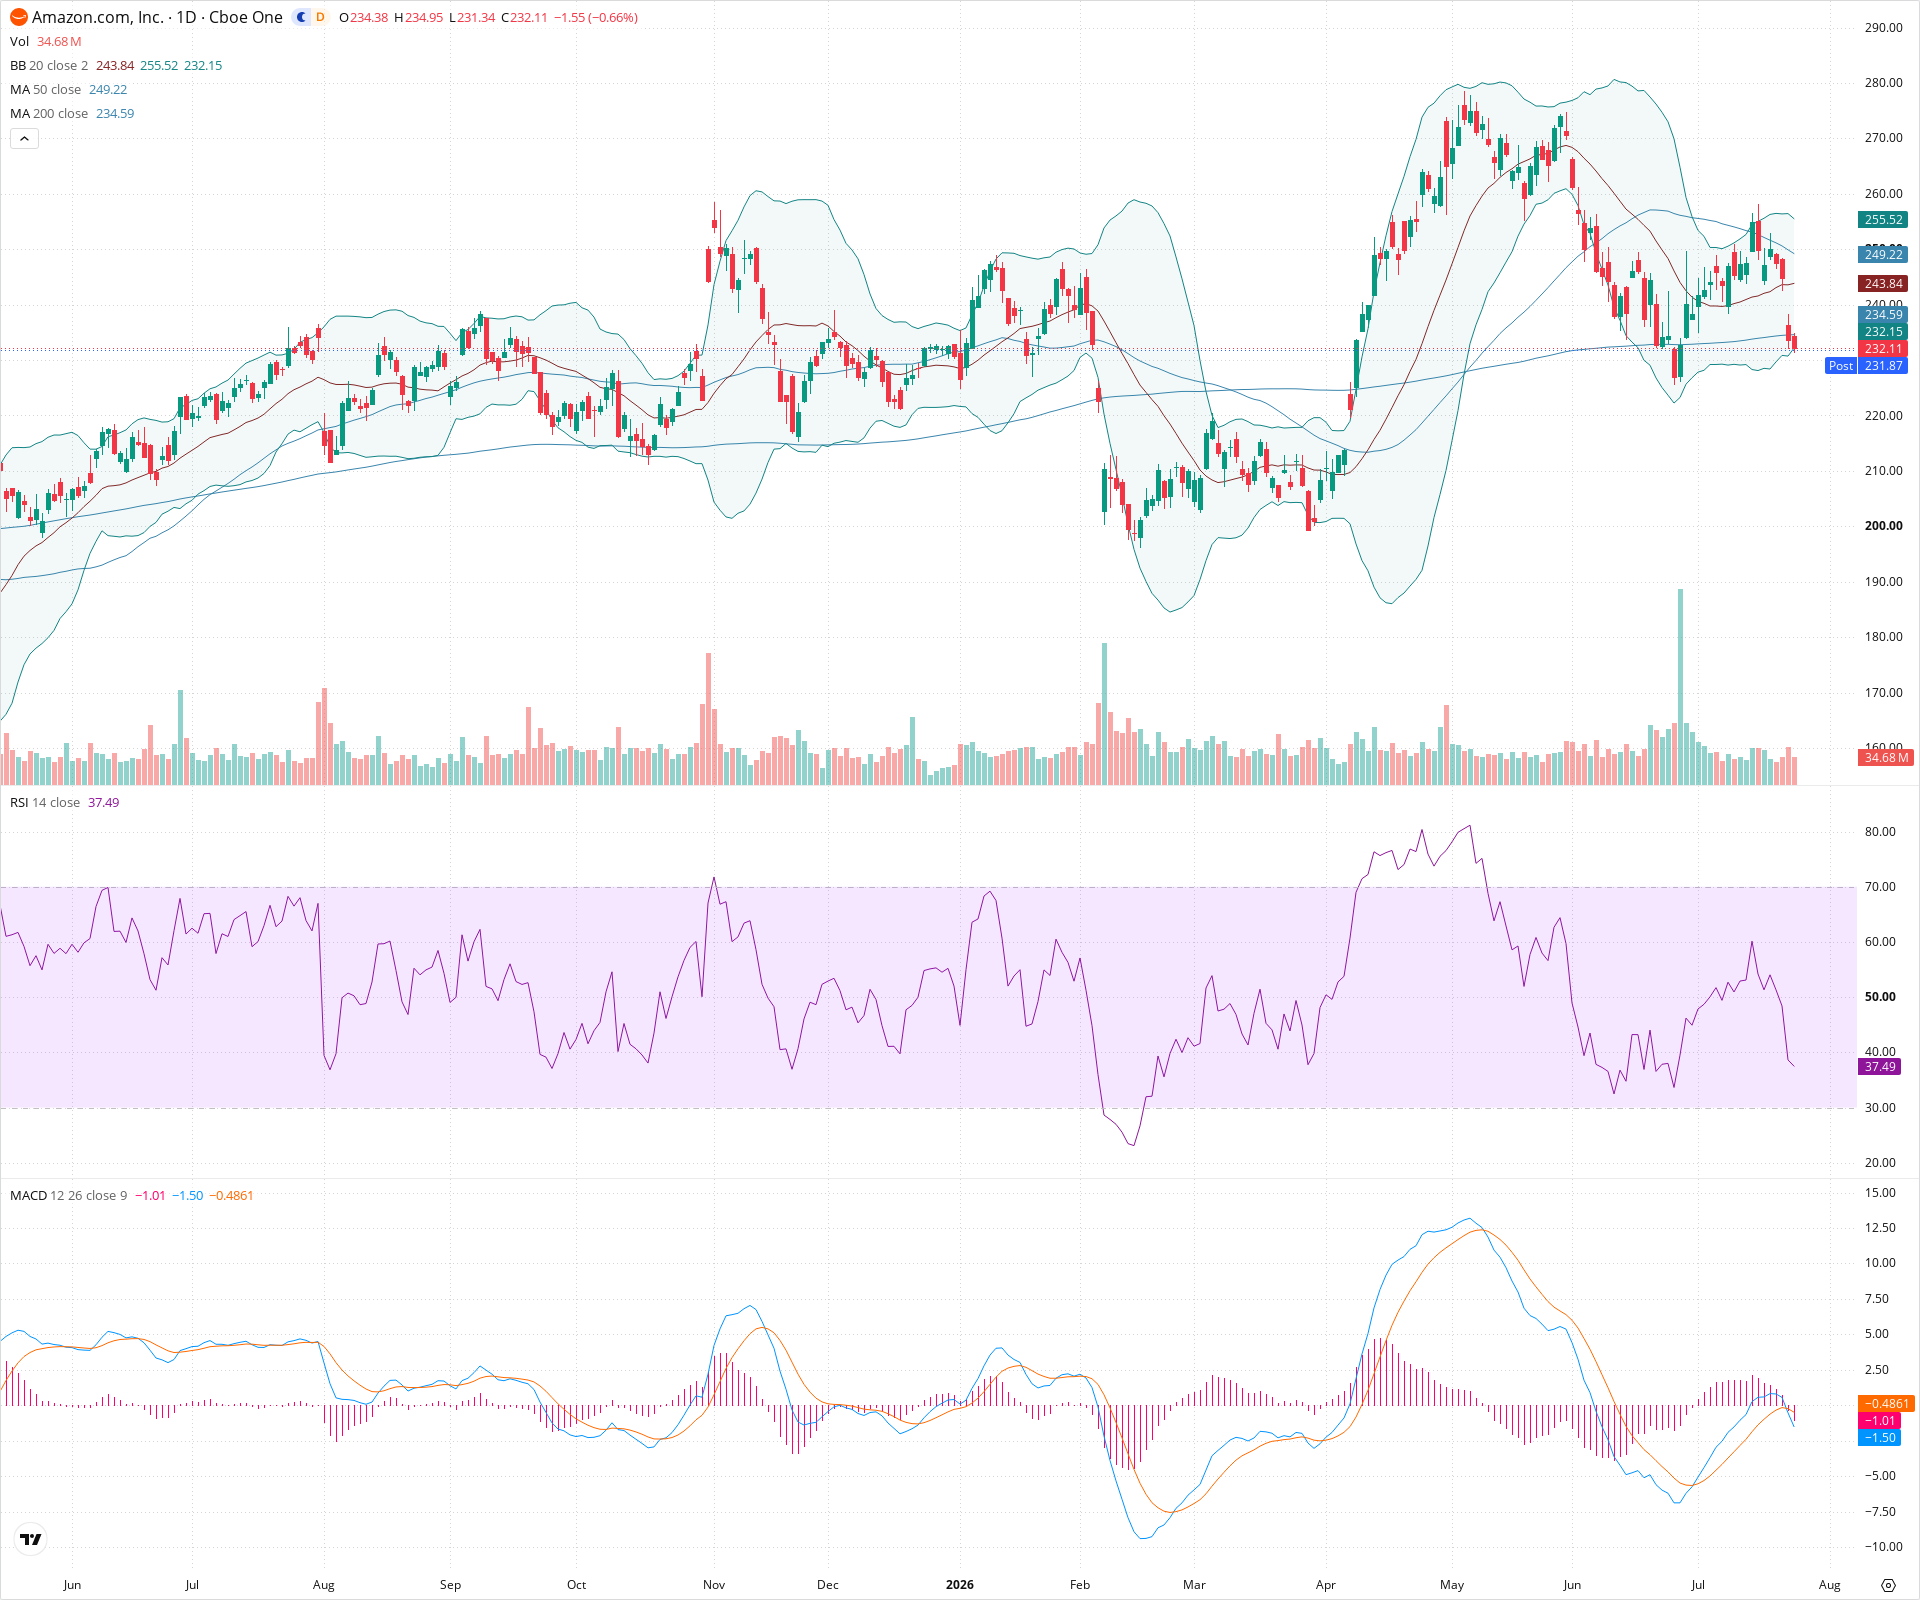
AMZN is currently experiencing a short-term pullback, breaking below key near-term moving averages (50 and 200 SMA) with bearish momentum indicated by the MACD and a declining RSI. While the long-term trend remains upward with higher highs, the immediate focus is on whether the price can hold critical support in the 225-230 range. A breakdown below this could confirm a larger topping pattern, while holding it may offer an entry for long-term investors.
Included In Lists
Related Tickers of Interest
AMZN Daily Chart
Sentiment
Short-term Sentiment (days to weeks): Neutral
Price is hovering near the lower Bollinger Band, with the MACD line crossing below the signal line and moving lower. RSI is declining around 37.49. Price is beneath the 50-day and 200-day SMAs. However, the price is nearing potential support, suggesting limited immediate downside.
Long-term Sentiment (weeks to months): Bullish
Despite the recent short-term pullback below the 50 and 200 SMAs, the longer-term structure still shows a sequence of higher highs and higher lows from the previous year. The 200-day SMA continues its upward slope.
Report Metadata
- Timeframe: daily
- Generated at: 2026-07-24T21:02:17.298Z
- Model: gemini-3.1-pro-preview
Support Price Levels
| Level | Range | Strength | Notes |
|---|---|---|---|
| $227.50 | $225.00 - $230.00 | Strong | Prior consolidation zone and recent swing low area around the lower Bollinger Band. |
| $212.50 | $210.00 - $215.00 | Strong | Major previous swing low structure and consolidation base from earlier in the year. |
Resistance Price Levels
| Level | Range | Strength | Notes |
|---|---|---|---|
| $246.00 | $243.00 - $249.00 | Strong | Cluster of resistance formed by the 20-day and 50-day SMAs, along with the recent breakdown level. |
| $272.50 | $270.00 - $275.00 | Strong | Previous major swing high peak. |
Potential Chart Patterns in Formation
| Strength | Pattern | Signal | Target | Details |
|---|---|---|---|---|
| Weak | Head and Shoulders (potential) | Bearish | $180.00 | A possible large head and shoulders topping pattern may have formed, with the peak near 280 acting as the head, and peaks near 260 acting as shoulders. The neckline would be the support area around 220-225. |
Frequently Asked Questions about AMZN
What is the current sentiment for AMZN?
The short-term sentiment for AMZN is currently Neutral because Price is hovering near the lower Bollinger Band, with the MACD line crossing below the signal line and moving lower. RSI is declining around 37.49. Price is beneath the 50-day and 200-day SMAs. However, the price is nearing potential support, suggesting limited immediate downside.. The long-term trend is classified as Bullish.
What are the key support levels for AMZN?
StockDips.AI has identified key support levels for AMZN at $227.50 and $212.50. These levels may represent potential accumulation zones where buying interest could emerge.
Is AMZN in a significant dip or a Value Dip right now?
AMZN has a Value Score of 75/100. It is currently flagged as a significant dip in the Top Dips list. It is also listed as a Value Dip because long-term sentiment is bullish.
View the full interactive analysis on StockDips.AI.