CVX Weekly Technical Analysis
Chevron Corporation
Integrated energy and chemical company
CVX Technical Analysis Summary
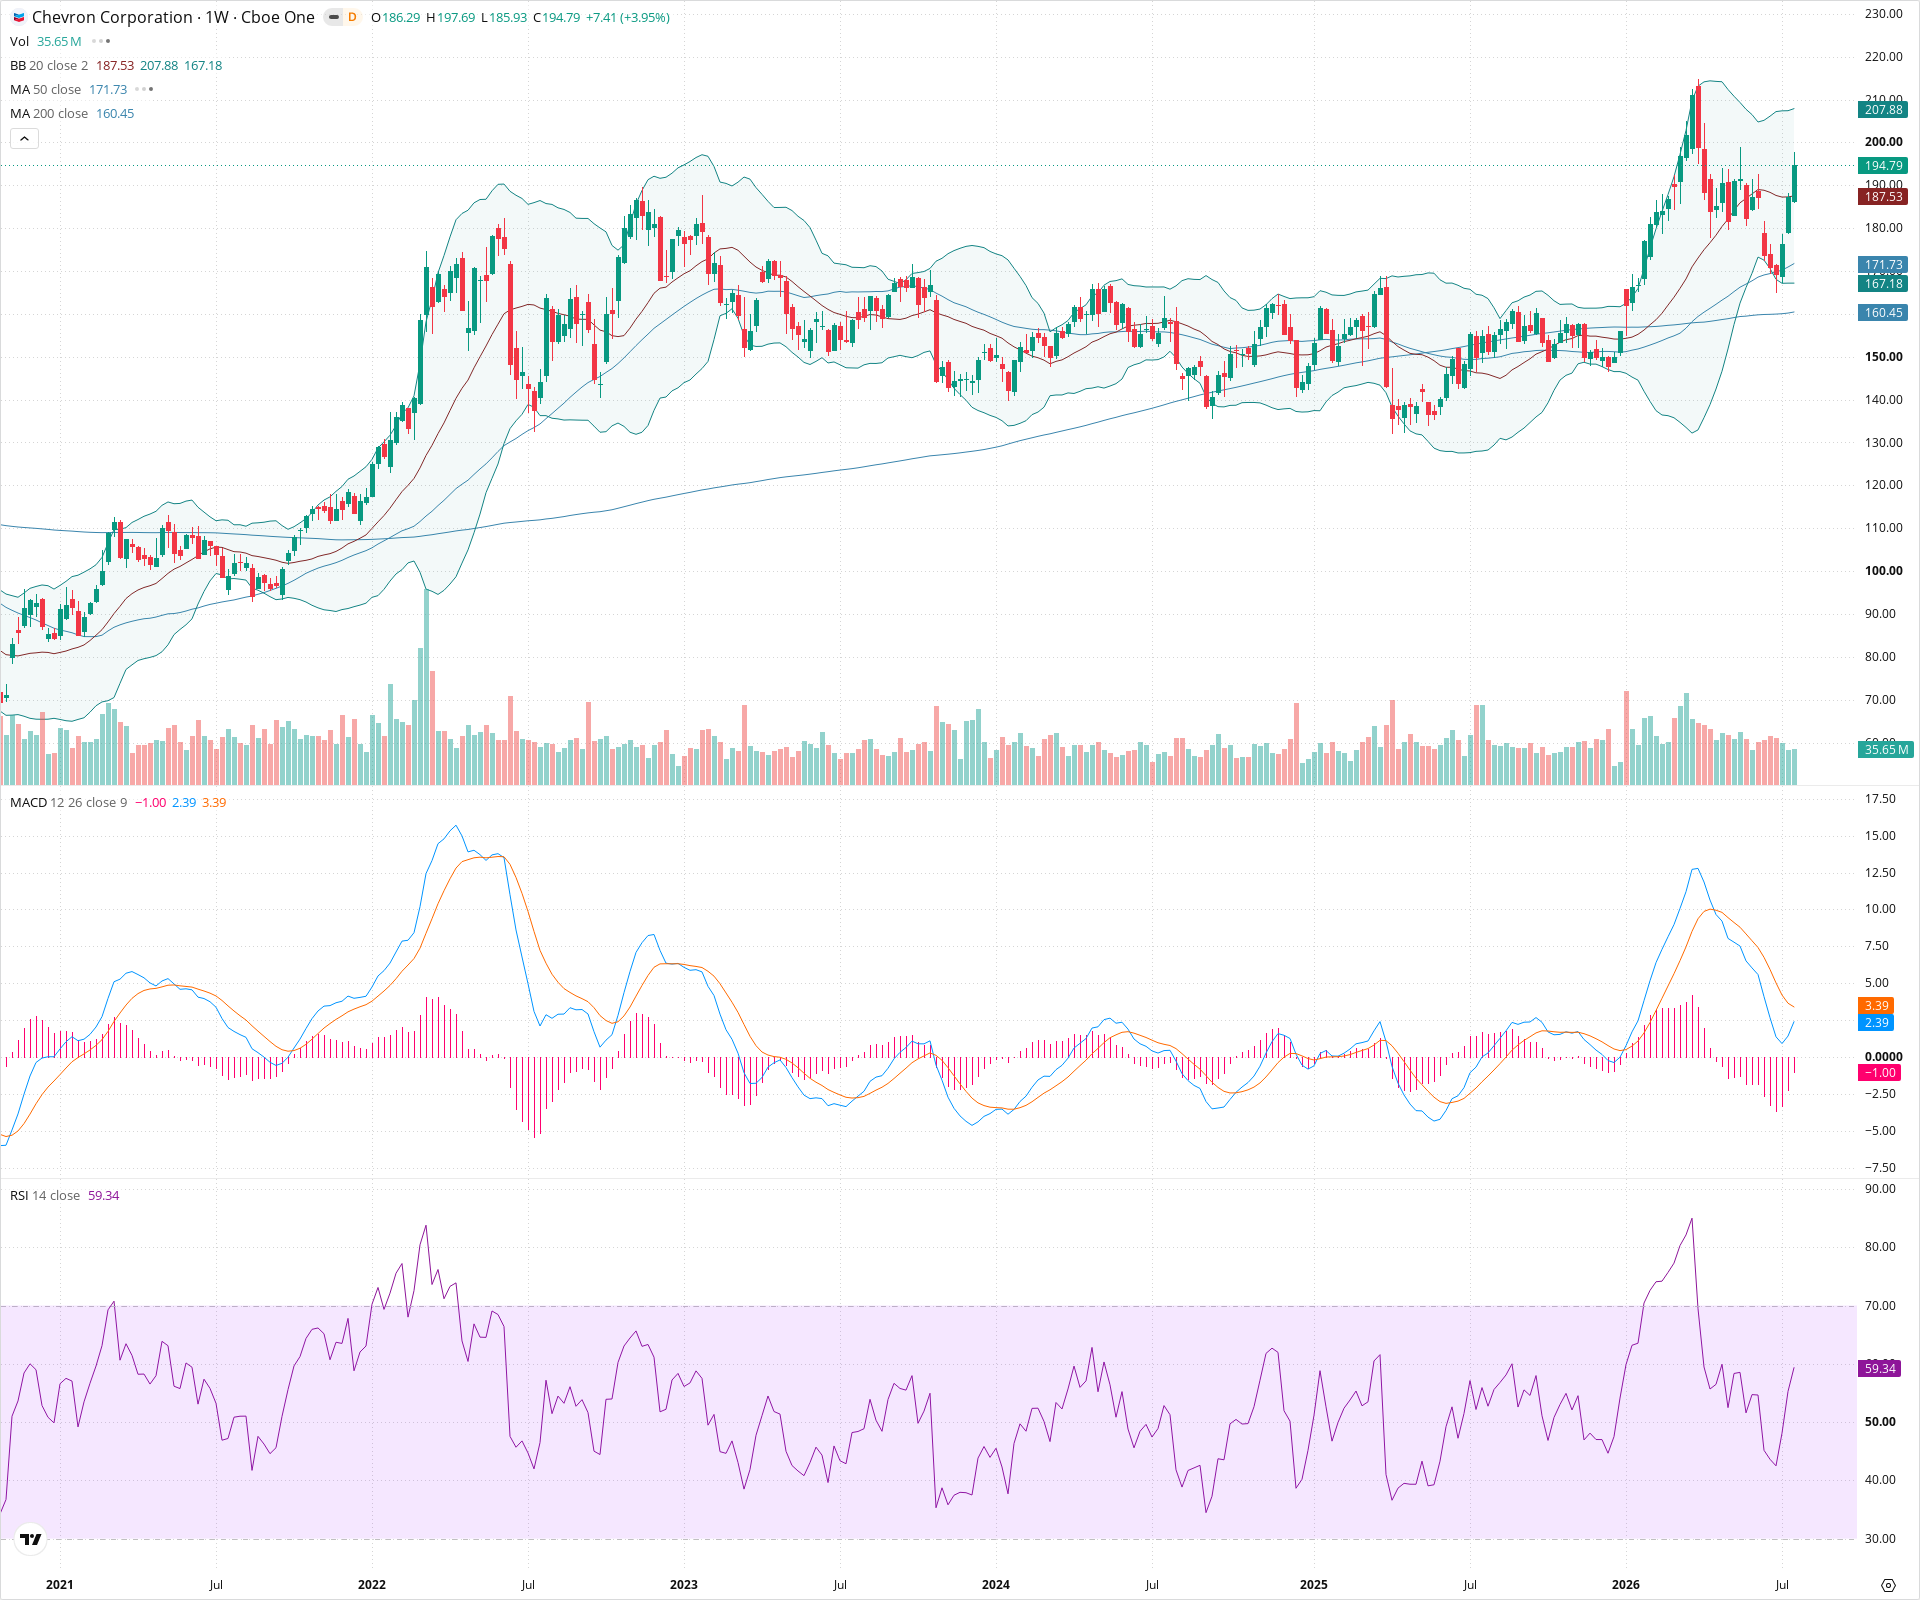
CVX exhibits a strong, multi-year uptrend on the weekly chart. After a significant run-up and a period of sideways consolidation, the price has found strong support near the 50-week SMA and is pushing back toward all-time highs. The alignment of moving averages confirms a robust long-term bullish trend.
Included In Lists
Related Tickers of Interest
CVX Weekly Chart
Sentiment
Short-term Sentiment (days to weeks): Bullish
Price is rebounding strongly off the 50-week MA and recent consolidation, approaching the previous highs with upward momentum.
Long-term Sentiment (weeks to months): Bullish
Price structure is characterized by a steady sequence of higher highs and higher lows, comfortably above all major moving averages, especially the rising 200-week SMA.
Report Metadata
- Timeframe: weekly
- Generated at: 2026-07-25T09:11:44.199Z
- Model: gemini-3.1-pro-preview
Support Price Levels
| Level | Range | Strength | Notes |
|---|---|---|---|
| $171.50 | $170.00 - $173.00 | Strong | Recent swing low consolidation area and confluence with the rising 50-week SMA. |
| $160.00 | $158.00 - $162.00 | Strong | Major prior swing low area and confluence with the 200-week SMA. |
Resistance Price Levels
| Level | Range | Strength | Notes |
|---|---|---|---|
| $200.00 | $198.00 - $202.00 | Strong | Recent all-time high area which acted as resistance. |
Potential Chart Patterns in Formation
| Strength | Pattern | Signal | Target | Details |
|---|---|---|---|---|
| Strong | Ascending Channel / Uptrend | Bullish | N/A | Price is moving consistently upward, creating higher highs and higher lows over a multi-year period. |
Frequently Asked Questions about CVX
What is the current sentiment for CVX?
The short-term sentiment for CVX is currently Bullish because Price is rebounding strongly off the 50-week MA and recent consolidation, approaching the previous highs with upward momentum.. The long-term trend is classified as Bullish.
What are the key support levels for CVX?
StockDips.AI has identified key support levels for CVX at $171.50 and $160.00. These levels may represent potential accumulation zones where buying interest could emerge.
Is CVX in a significant dip or a Value Dip right now?
CVX has a Value Score of 30/100. It is not currently flagged as a significant dip in the Top Dips list. It is not listed as a Value Dip because the long-term sentiment or value-score threshold does not qualify.
View the full interactive analysis on StockDips.AI.