TSM Daily Technical Analysis
Taiwan Semiconductor Manufacturing Co
World's largest semiconductor foundry manufacturing advanced chips for major tech firms.
TSM Technical Analysis Summary
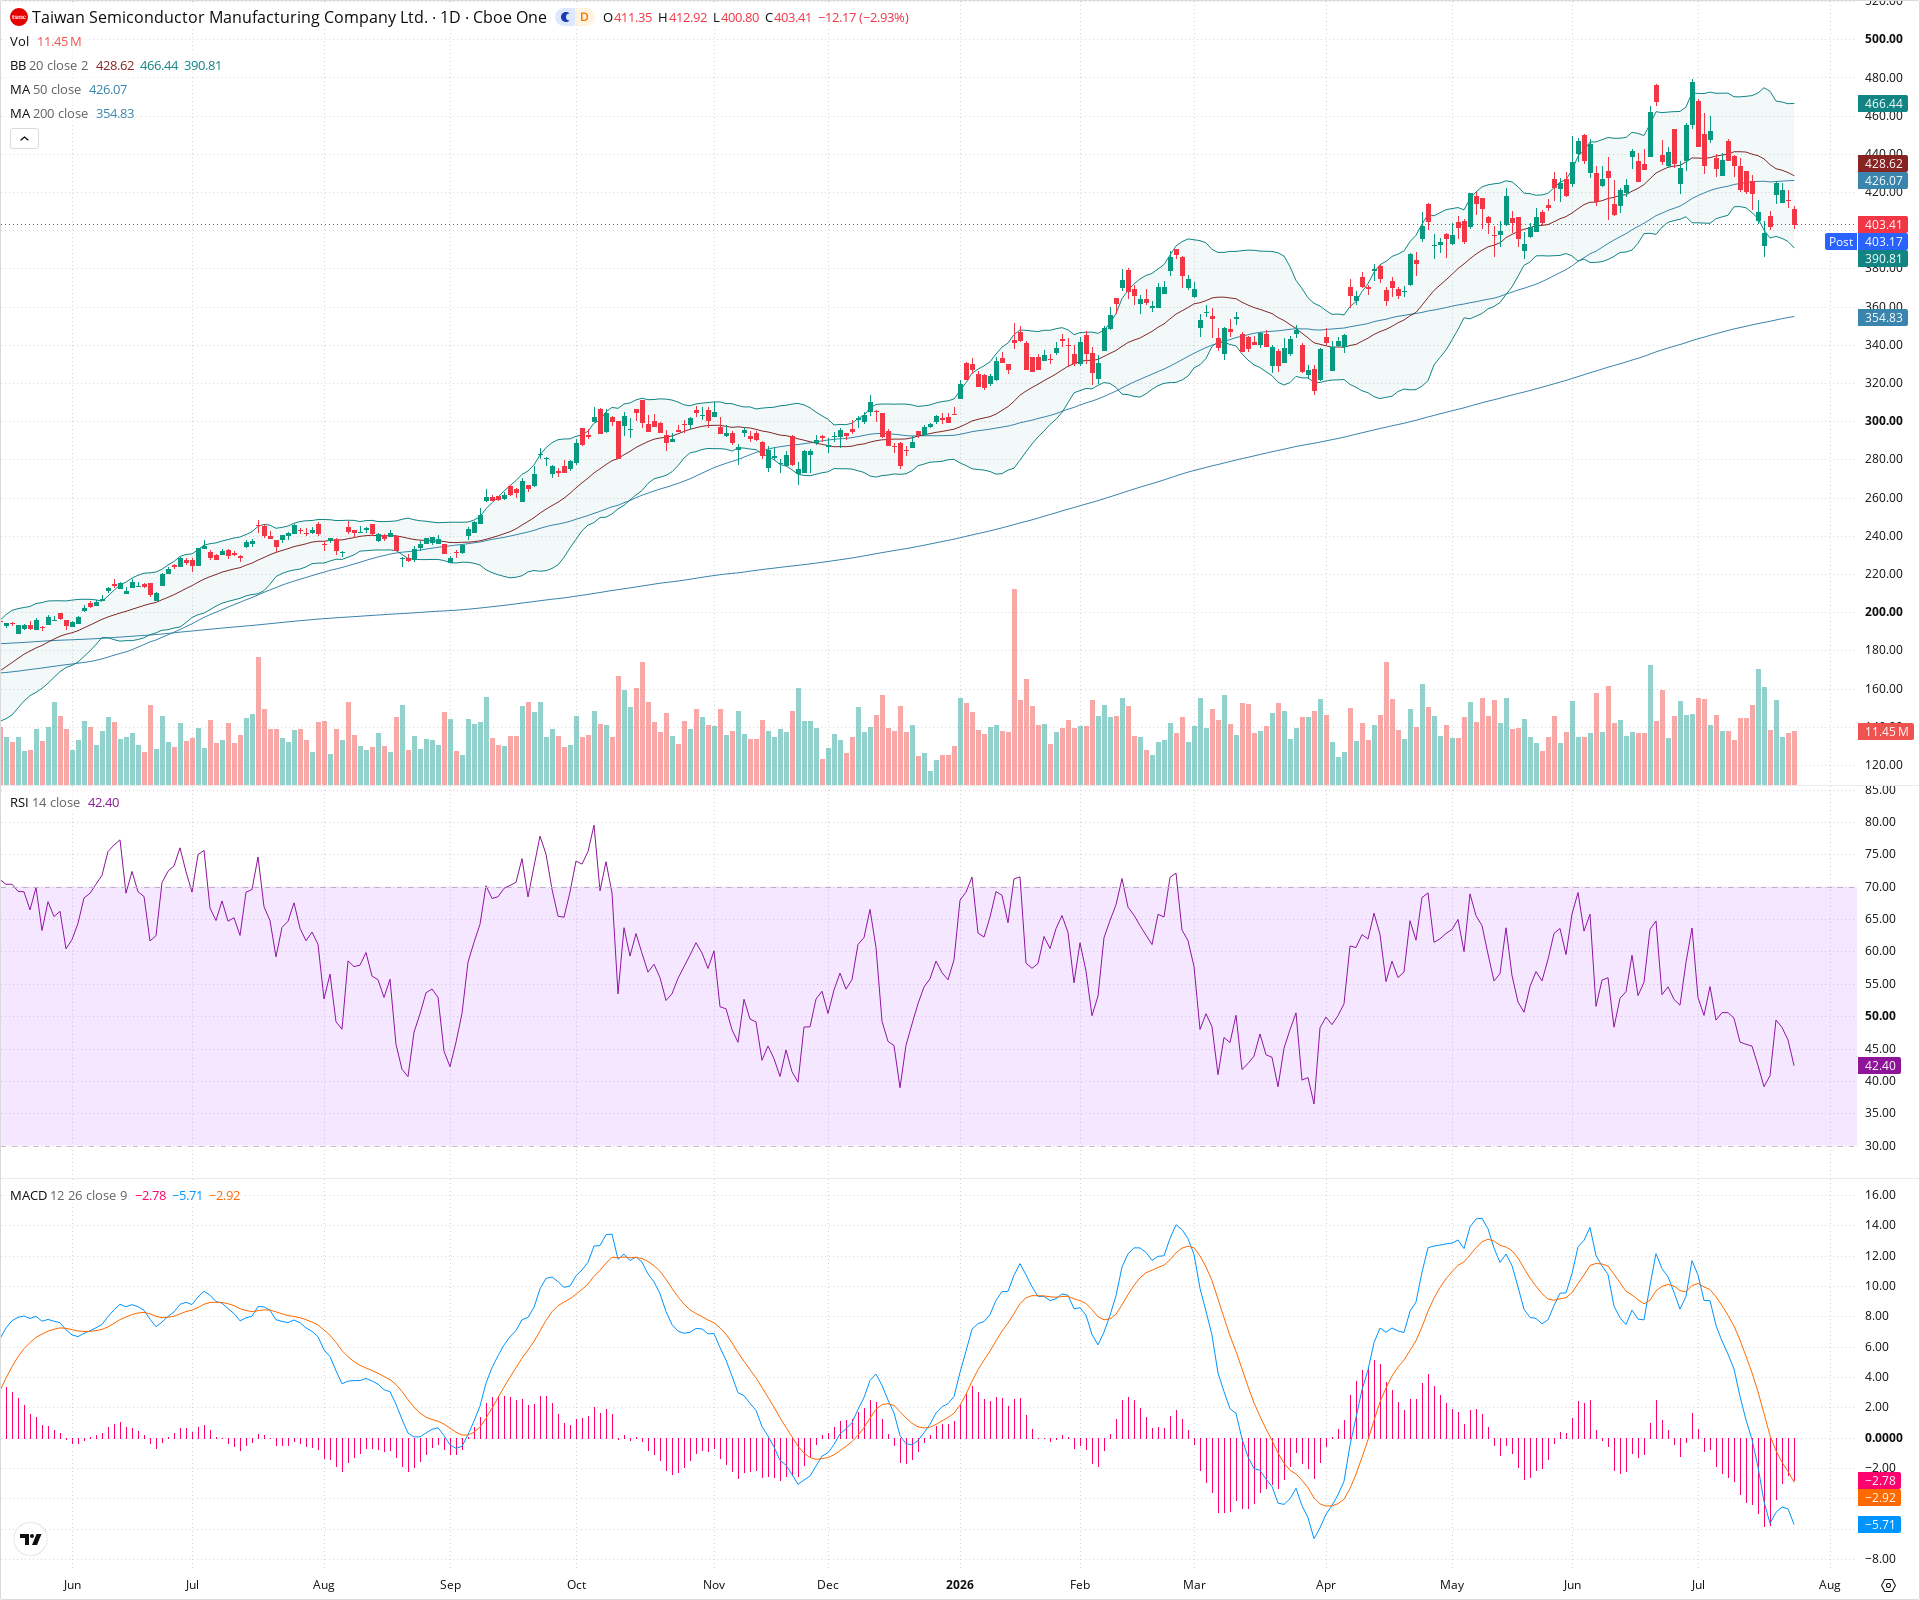
TSM is currently experiencing a sharp short-term correction, having broken down from a double top pattern and falling below key near-term moving averages. Momentum indicators like MACD and RSI confirm the ongoing bearish pressure. However, for long-term investors, the broader structural uptrend remains intact as long as the price holds above the rising 200-day moving average. The stock is approaching an initial support zone near 390, which may act as a near-term stabilizing level.
Included In Lists
Related Tickers of Interest
TSM Daily Chart
Sentiment
Short-term Sentiment (days to weeks): Bearish
Price has sharply broken below the 20-day and 50-day moving averages. Momentum indicators are negative, with RSI falling towards oversold levels and MACD showing a bearish crossover with an expanding negative histogram.
Long-term Sentiment (weeks to months): Bullish
Despite the severe short-term pullback, the price remains well above a steadily rising 200-day moving average, keeping the primary macro uptrend intact.
Report Metadata
- Timeframe: daily
- Generated at: 2026-07-24T21:03:21.200Z
- Model: gemini-3.1-pro-preview
Support Price Levels
| Level | Range | Strength | Notes |
|---|---|---|---|
| $392.50 | $390.00 - $395.00 | Strong | Confluence of the lower Bollinger Band and a minor consolidation area from late May/early June. It also aligns with a measured move target from recent topping patterns. |
| $375.00 | $370.00 - $380.00 | Strong | Significant prior consolidation zone established in April and early May before the last major upward leg. |
| $352.50 | $350.00 - $355.00 | Strong | The location of the rising 200-day simple moving average, representing a major dynamic long-term support level. |
Resistance Price Levels
| Level | Range | Strength | Notes |
|---|---|---|---|
| $428.00 | $426.00 - $430.00 | Strong | Immediate overhead resistance zone formed by the broken 50-day SMA, the 20-day SMA, and recent breakdown levels. |
| $467.50 | $465.00 - $470.00 | Weak | Area of recent lower highs and the approximate location of the upper Bollinger Band. |
Potential Chart Patterns in Formation
| Strength | Pattern | Signal | Target | Details |
|---|---|---|---|---|
| Strong | Double Top Breakdown | Bearish | $390.00 | Price formed two distinct peaks near 480 in June and July. It has recently broken below the intervening trough (neckline) around 430-435, confirming a short-term bearish reversal. |
Frequently Asked Questions about TSM
What is the current sentiment for TSM?
The short-term sentiment for TSM is currently Bearish because Price has sharply broken below the 20-day and 50-day moving averages. Momentum indicators are negative, with RSI falling towards oversold levels and MACD showing a bearish crossover with an expanding negative histogram.. The long-term trend is classified as Bullish.
What are the key support levels for TSM?
StockDips.AI has identified key support levels for TSM at $392.50 and $375.00. These levels may represent potential accumulation zones where buying interest could emerge.
Is TSM in a significant dip or a Value Dip right now?
TSM has a Value Score of 69/100. It is not currently flagged as a significant dip in the Top Dips list. It is not listed as a Value Dip because the long-term sentiment or value-score threshold does not qualify.
View the full interactive analysis on StockDips.AI.