ENPH Daily Technical Analysis
Enphase Energy, Inc
Home energy technology specializing in solutions that manage energy generation, storage, control, and communication through one integrated platform.
ENPH Technical Analysis Summary
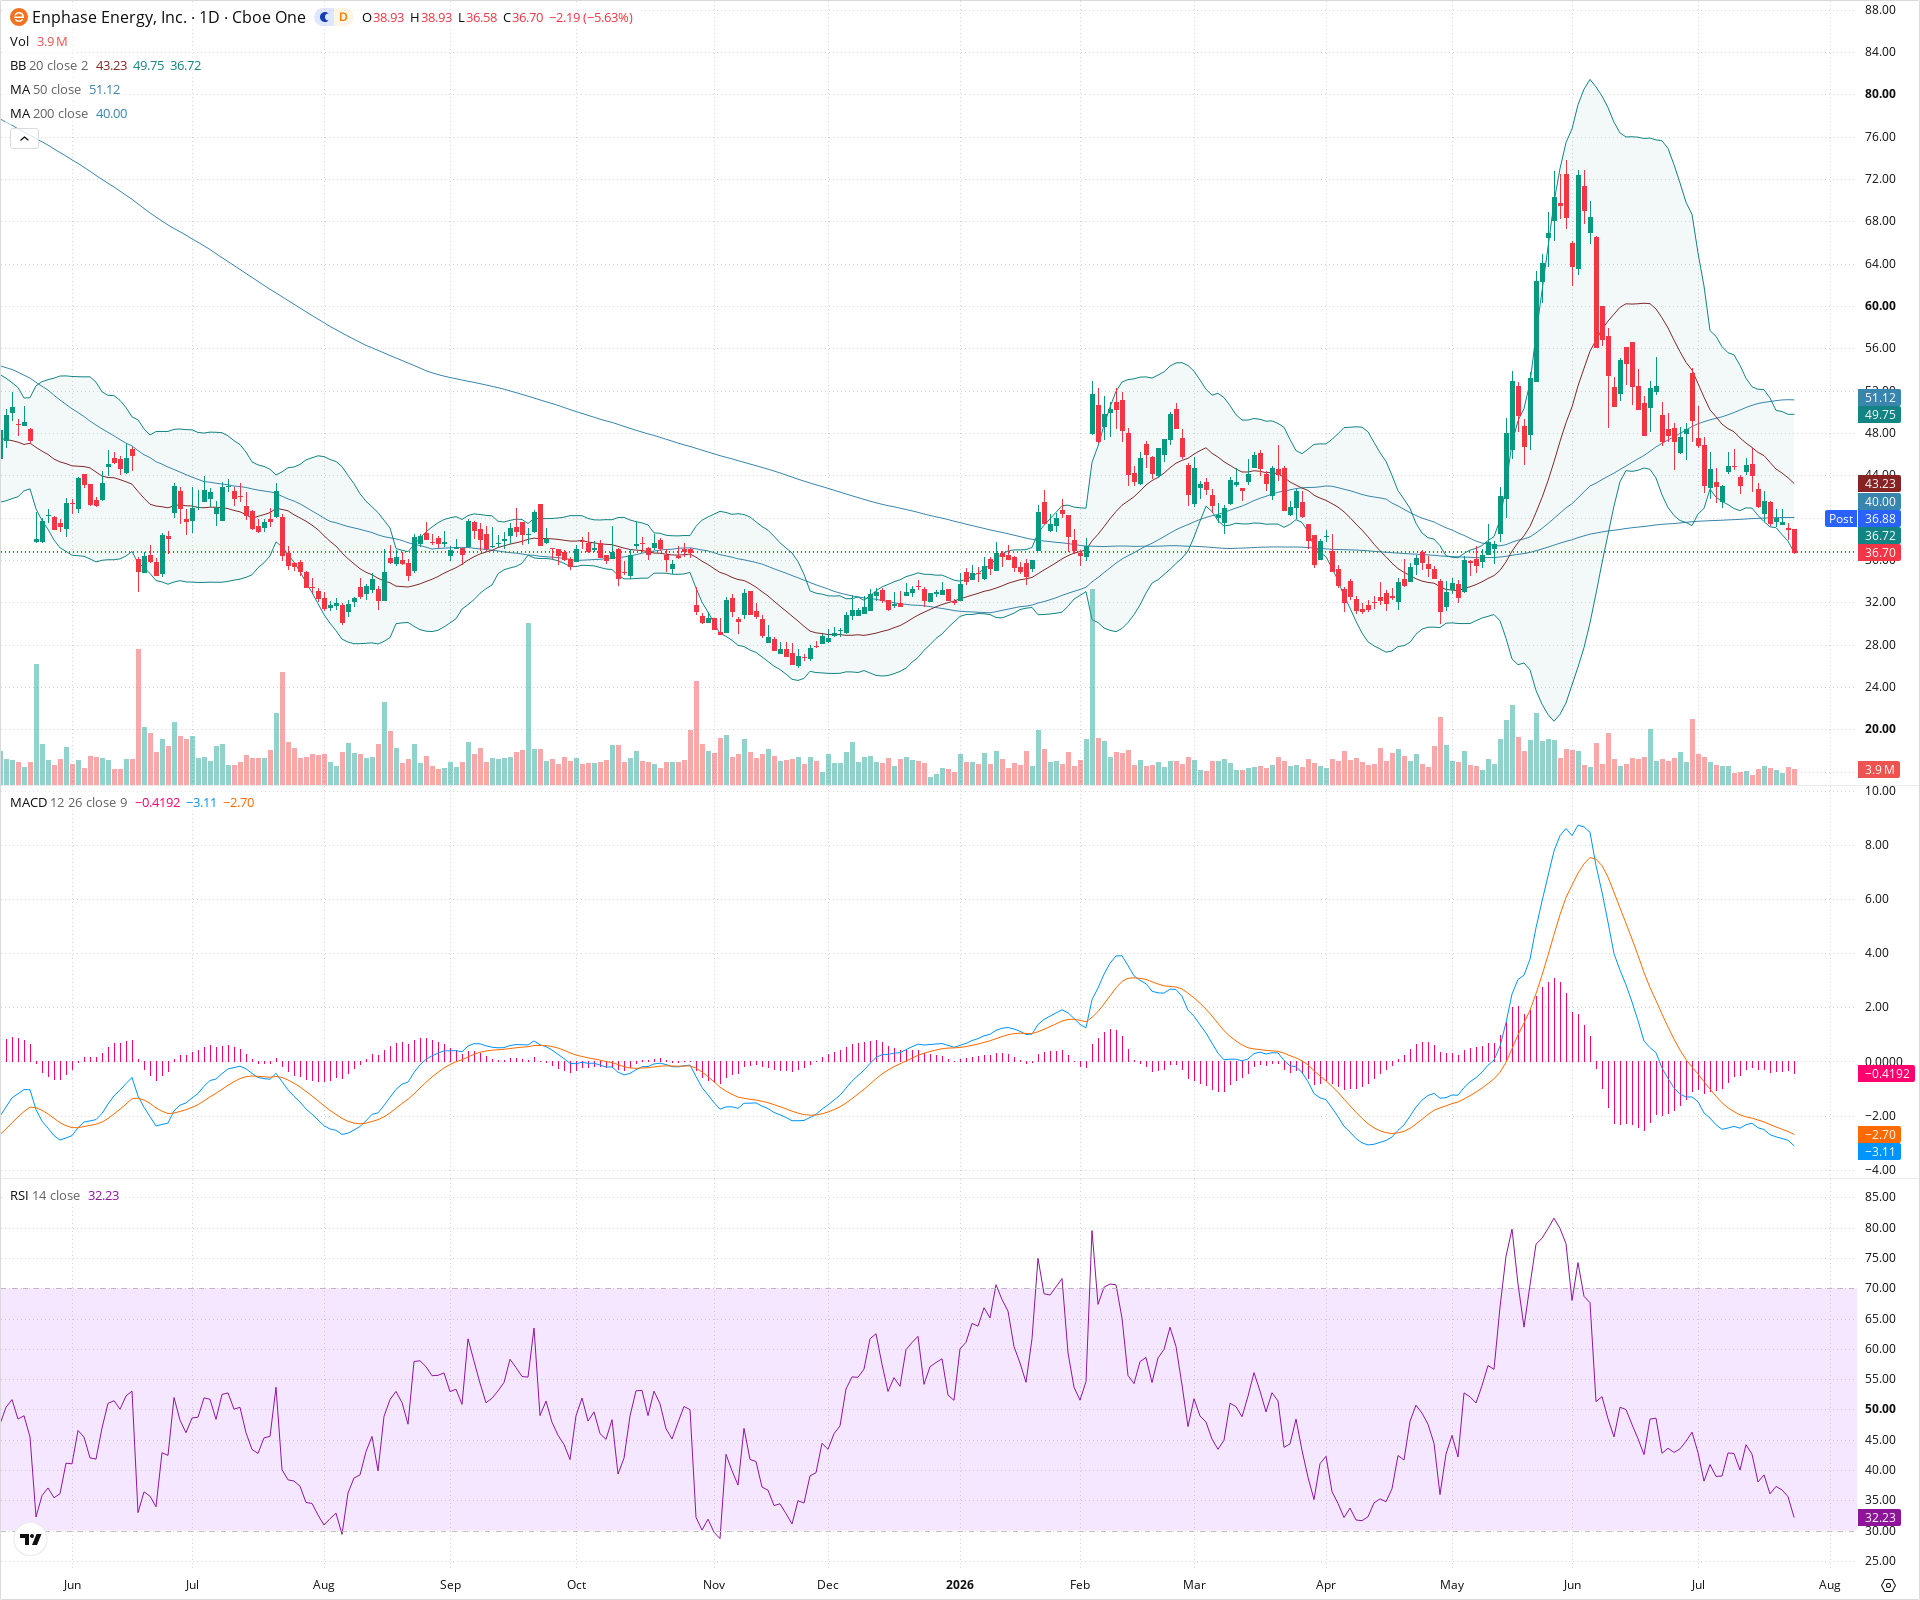
ENPH is exhibiting a severe and sustained downtrend across all visible timeframes, having broken down from a massive topping structure. Technical indicators, including a bearish MACD configuration, falling MAs, and a negative RSI trajectory, all confirm strong ongoing selling pressure. While RSI approaches oversold territory, the dominant trend remains heavily bearish, suggesting extreme caution for long-oriented investors until clear signs of a base form.
Included In Lists
Related Tickers of Interest
ENPH Daily Chart
Sentiment
Short-term Sentiment (days to weeks): Bearish
Price is in a steep near-term decline, trading well below the descending 20-day and 50-day SMAs. It is currently pushing against the lower Bollinger Band with strong negative momentum shown by expanding red MACD histogram bars and RSI falling sharply toward oversold levels.
Long-term Sentiment (weeks to months): Bearish
The chart shows a massive topping structure followed by a severe breakdown. The 50-day SMA is below the 200-day SMA (Death Cross) and both are trending lower, confirming a dominant long-term downtrend.
Report Metadata
- Timeframe: daily
- Generated at: 2026-07-24T21:15:16.298Z
- Model: gemini-3.1-pro-preview
Support Price Levels
| Level | Range | Strength | Notes |
|---|---|---|---|
| $33.00 | $32.00 - $34.00 | Weak | Minor structural support derived from a previous consolidation phase visible in the left half of the chart. |
| $29.00 | $28.00 - $30.00 | Strong | Major historical swing low visible on the far left of the chart; likely the next significant area of structural support if the current selloff continues. |
Resistance Price Levels
| Level | Range | Strength | Notes |
|---|---|---|---|
| $41.75 | $40.00 - $43.50 | Strong | Immediate overhead resistance zone comprising the 200-day SMA (40.00), psychological round number, and recent structural breakdown levels. |
| $50.00 | $48.00 - $52.00 | Strong | Significant overhead resistance block aligning with previous swing highs and the descending 50-day SMA (51.12). |
Potential Chart Patterns in Formation
| Strength | Pattern | Signal | Target | Details |
|---|---|---|---|---|
| Strong | Descending Channel / Steep Downtrend | Bearish | N/A | Price action is contained within a clear, aggressive downward trajectory marked by lower highs and lower lows since the peak near 80. |
| Strong | Death Cross | Bearish | N/A | The 50-day SMA crossed below the 200-day SMA in the past, and both continue to slope downwards, confirming the overarching bearish macro trend. |
Frequently Asked Questions about ENPH
What is the current sentiment for ENPH?
The short-term sentiment for ENPH is currently Bearish because Price is in a steep near-term decline, trading well below the descending 20-day and 50-day SMAs. It is currently pushing against the lower Bollinger Band with strong negative momentum shown by expanding red MACD histogram bars and RSI falling sharply toward oversold levels.. The long-term trend is classified as Bearish.
What are the key support levels for ENPH?
StockDips.AI has identified key support levels for ENPH at $33.00 and $29.00. These levels may represent potential accumulation zones where buying interest could emerge.
Is ENPH in a significant dip or a Value Dip right now?
ENPH has a Value Score of 58/100. It is not currently flagged as a significant dip in the Top Dips list. It is not listed as a Value Dip because the long-term sentiment or value-score threshold does not qualify.
View the full interactive analysis on StockDips.AI.