ENPH Weekly Technical Analysis
Enphase Energy, Inc
Home energy technology specializing in solutions that manage energy generation, storage, control, and communication through one integrated platform.
ENPH Technical Analysis Summary
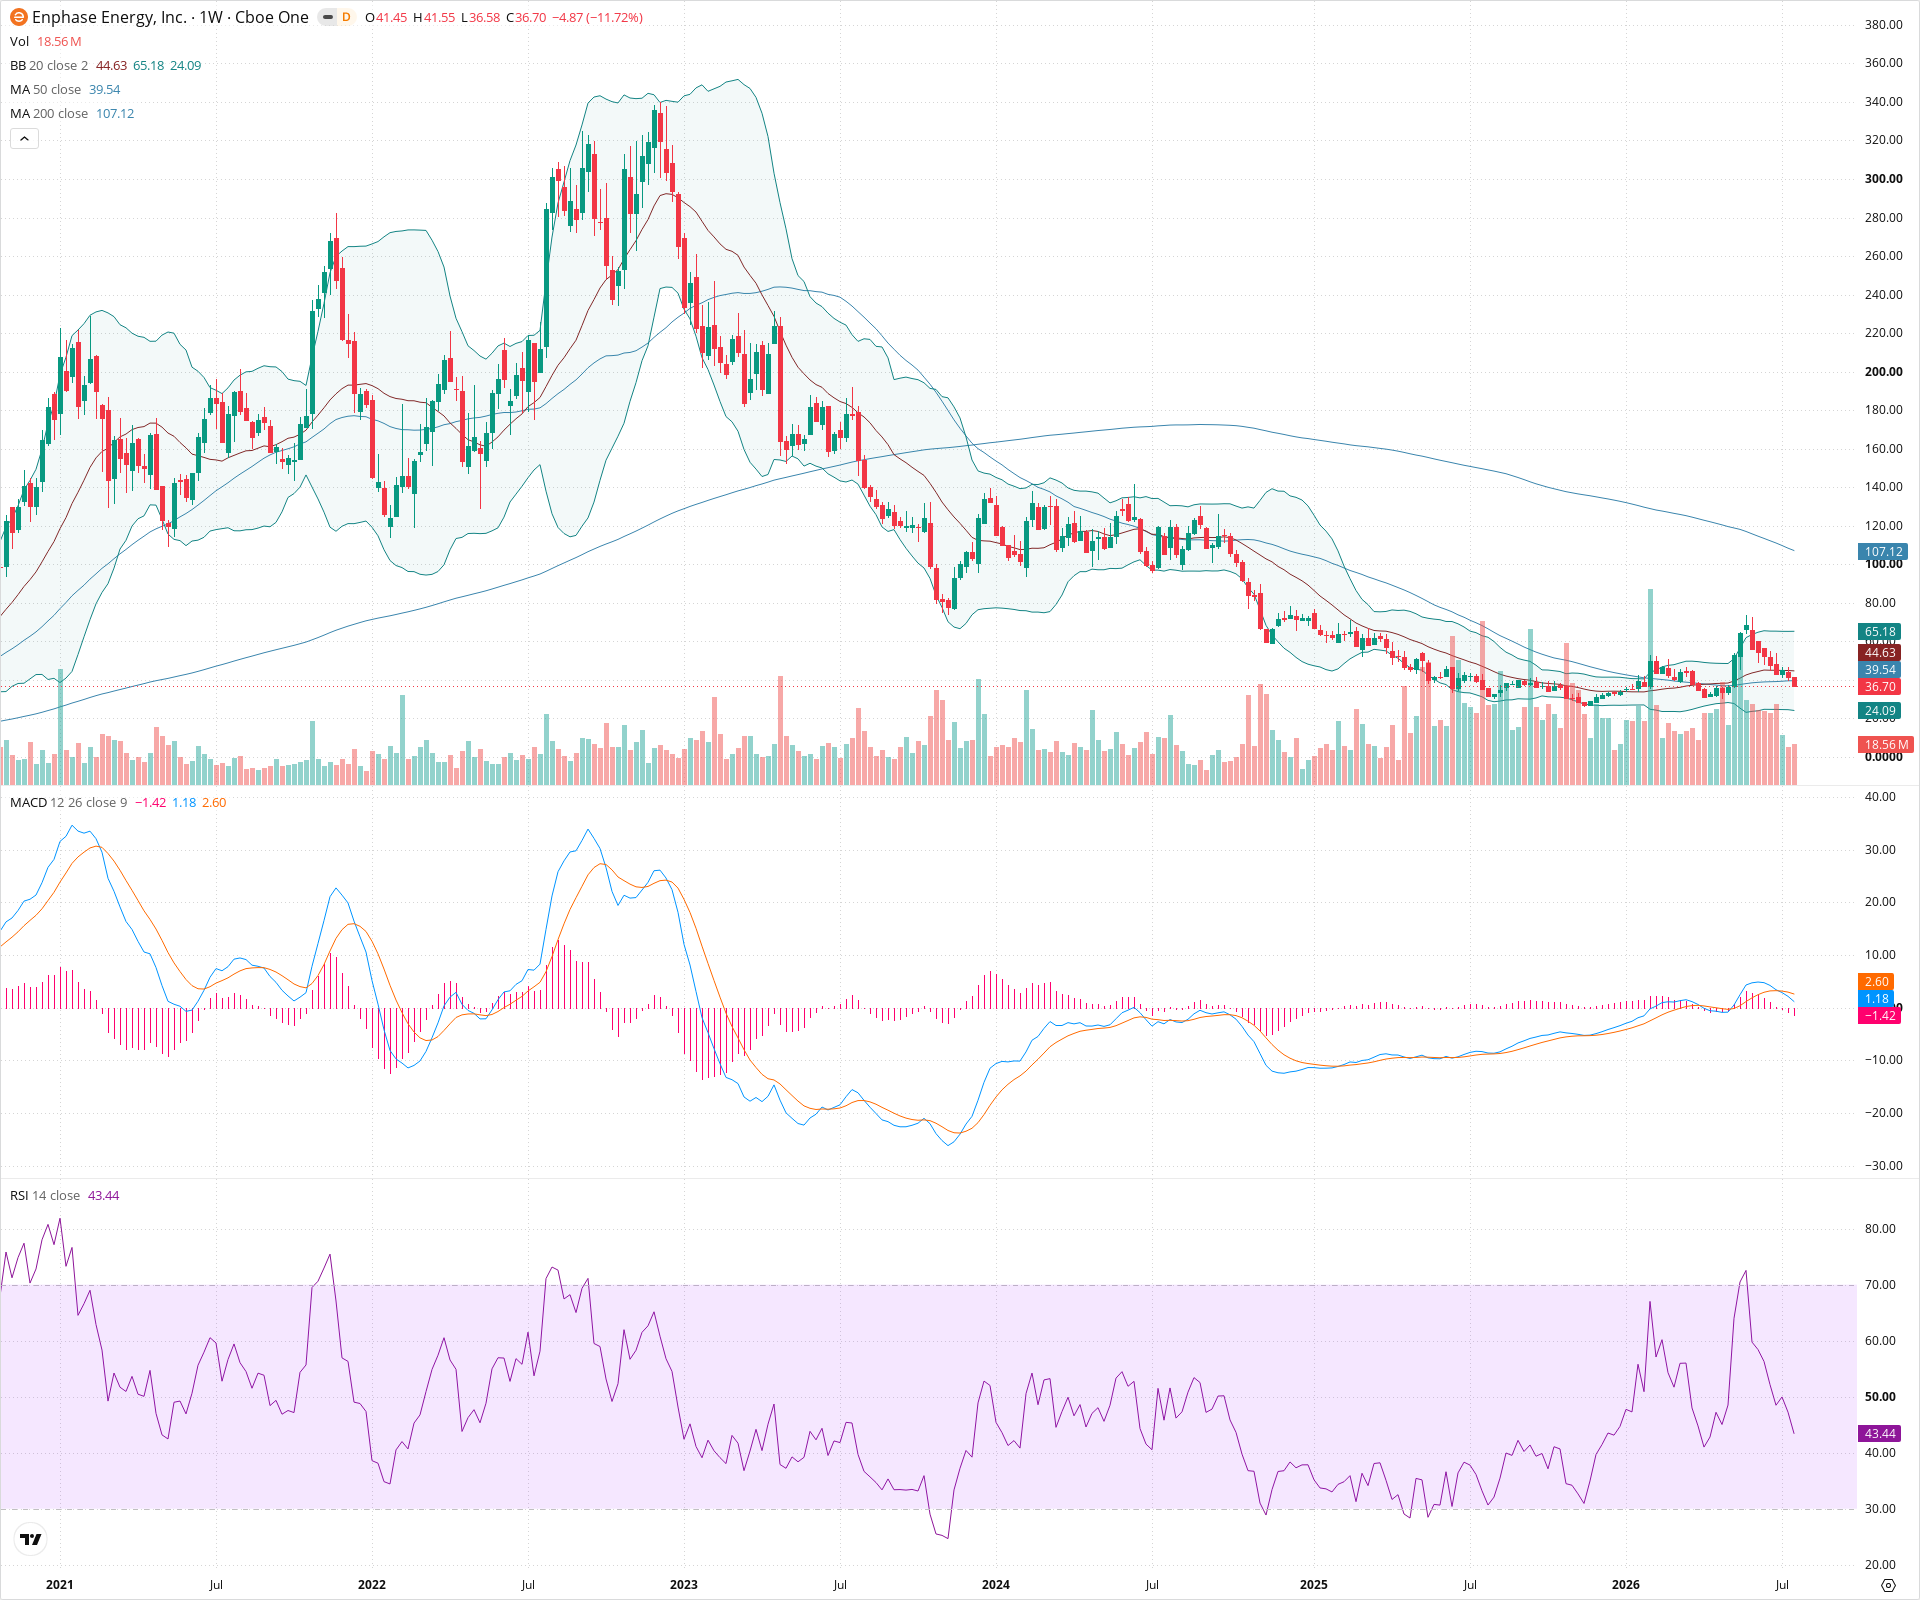
ENPH remains in a deeply entrenched multi-year downtrend. The recent counter-trend rally was sharply rejected at the 50-week SMA, resulting in a bearish MACD crossover and a resumption of downward momentum. Long-term investors should note that the primary trend remains heavily bearish as long as price is suppressed below the major moving averages.
Included In Lists
Related Tickers of Interest
ENPH Weekly Chart
Sentiment
Short-term Sentiment (days to weeks): Bearish
Price has been rejected from the 50-week SMA, forming a large bearish candle this week. MACD has crossed bearishly near the zero line, and RSI is declining below 50.
Long-term Sentiment (weeks to months): Bearish
The stock is in a multi-year downtrend, characterized by lower highs and lower lows. Price remains firmly below a declining 200-week SMA.
Report Metadata
- Timeframe: weekly
- Generated at: 2026-07-25T09:14:00.398Z
- Model: gemini-3.1-pro-preview
Support Price Levels
| Level | Range | Strength | Notes |
|---|---|---|---|
| $22.50 | $20.00 - $25.00 | Strong | Major structural swing low established recently. |
Resistance Price Levels
| Level | Range | Strength | Notes |
|---|---|---|---|
| $42.25 | $39.50 - $45.00 | Strong | Confluence of the 20-week and 50-week SMAs acting as dynamic resistance. |
| $65.00 | $60.00 - $70.00 | Strong | Recent lower high and significant structural resistance zone. |
| $107.50 | $105.00 - $110.00 | Strong | Area of the 200-week SMA and previous structural breakdown level. |
Potential Chart Patterns in Formation
| Strength | Pattern | Signal | Target | Details |
|---|---|---|---|---|
| Strong | Lower High Formation | Bearish | $20.00 | The recent rally failed to surpass previous structural highs and reversed at the 50-week SMA, confirming the ongoing macro downtrend. |
Frequently Asked Questions about ENPH
What is the current sentiment for ENPH?
The short-term sentiment for ENPH is currently Bearish because Price has been rejected from the 50-week SMA, forming a large bearish candle this week. MACD has crossed bearishly near the zero line, and RSI is declining below 50.. The long-term trend is classified as Bearish.
What are the key support levels for ENPH?
StockDips.AI has identified key support levels for ENPH at $22.50. These levels may represent potential accumulation zones where buying interest could emerge.
Is ENPH in a significant dip or a Value Dip right now?
ENPH has a Value Score of 58/100. It is not currently flagged as a significant dip in the Top Dips list. It is not listed as a Value Dip because the long-term sentiment or value-score threshold does not qualify.
View the full interactive analysis on StockDips.AI.