UEC Daily Technical Analysis
Uranium Energy Corp
Uranium mining and exploration company positioned to benefit from rising nuclear fuel demand.
UEC Technical Analysis Summary
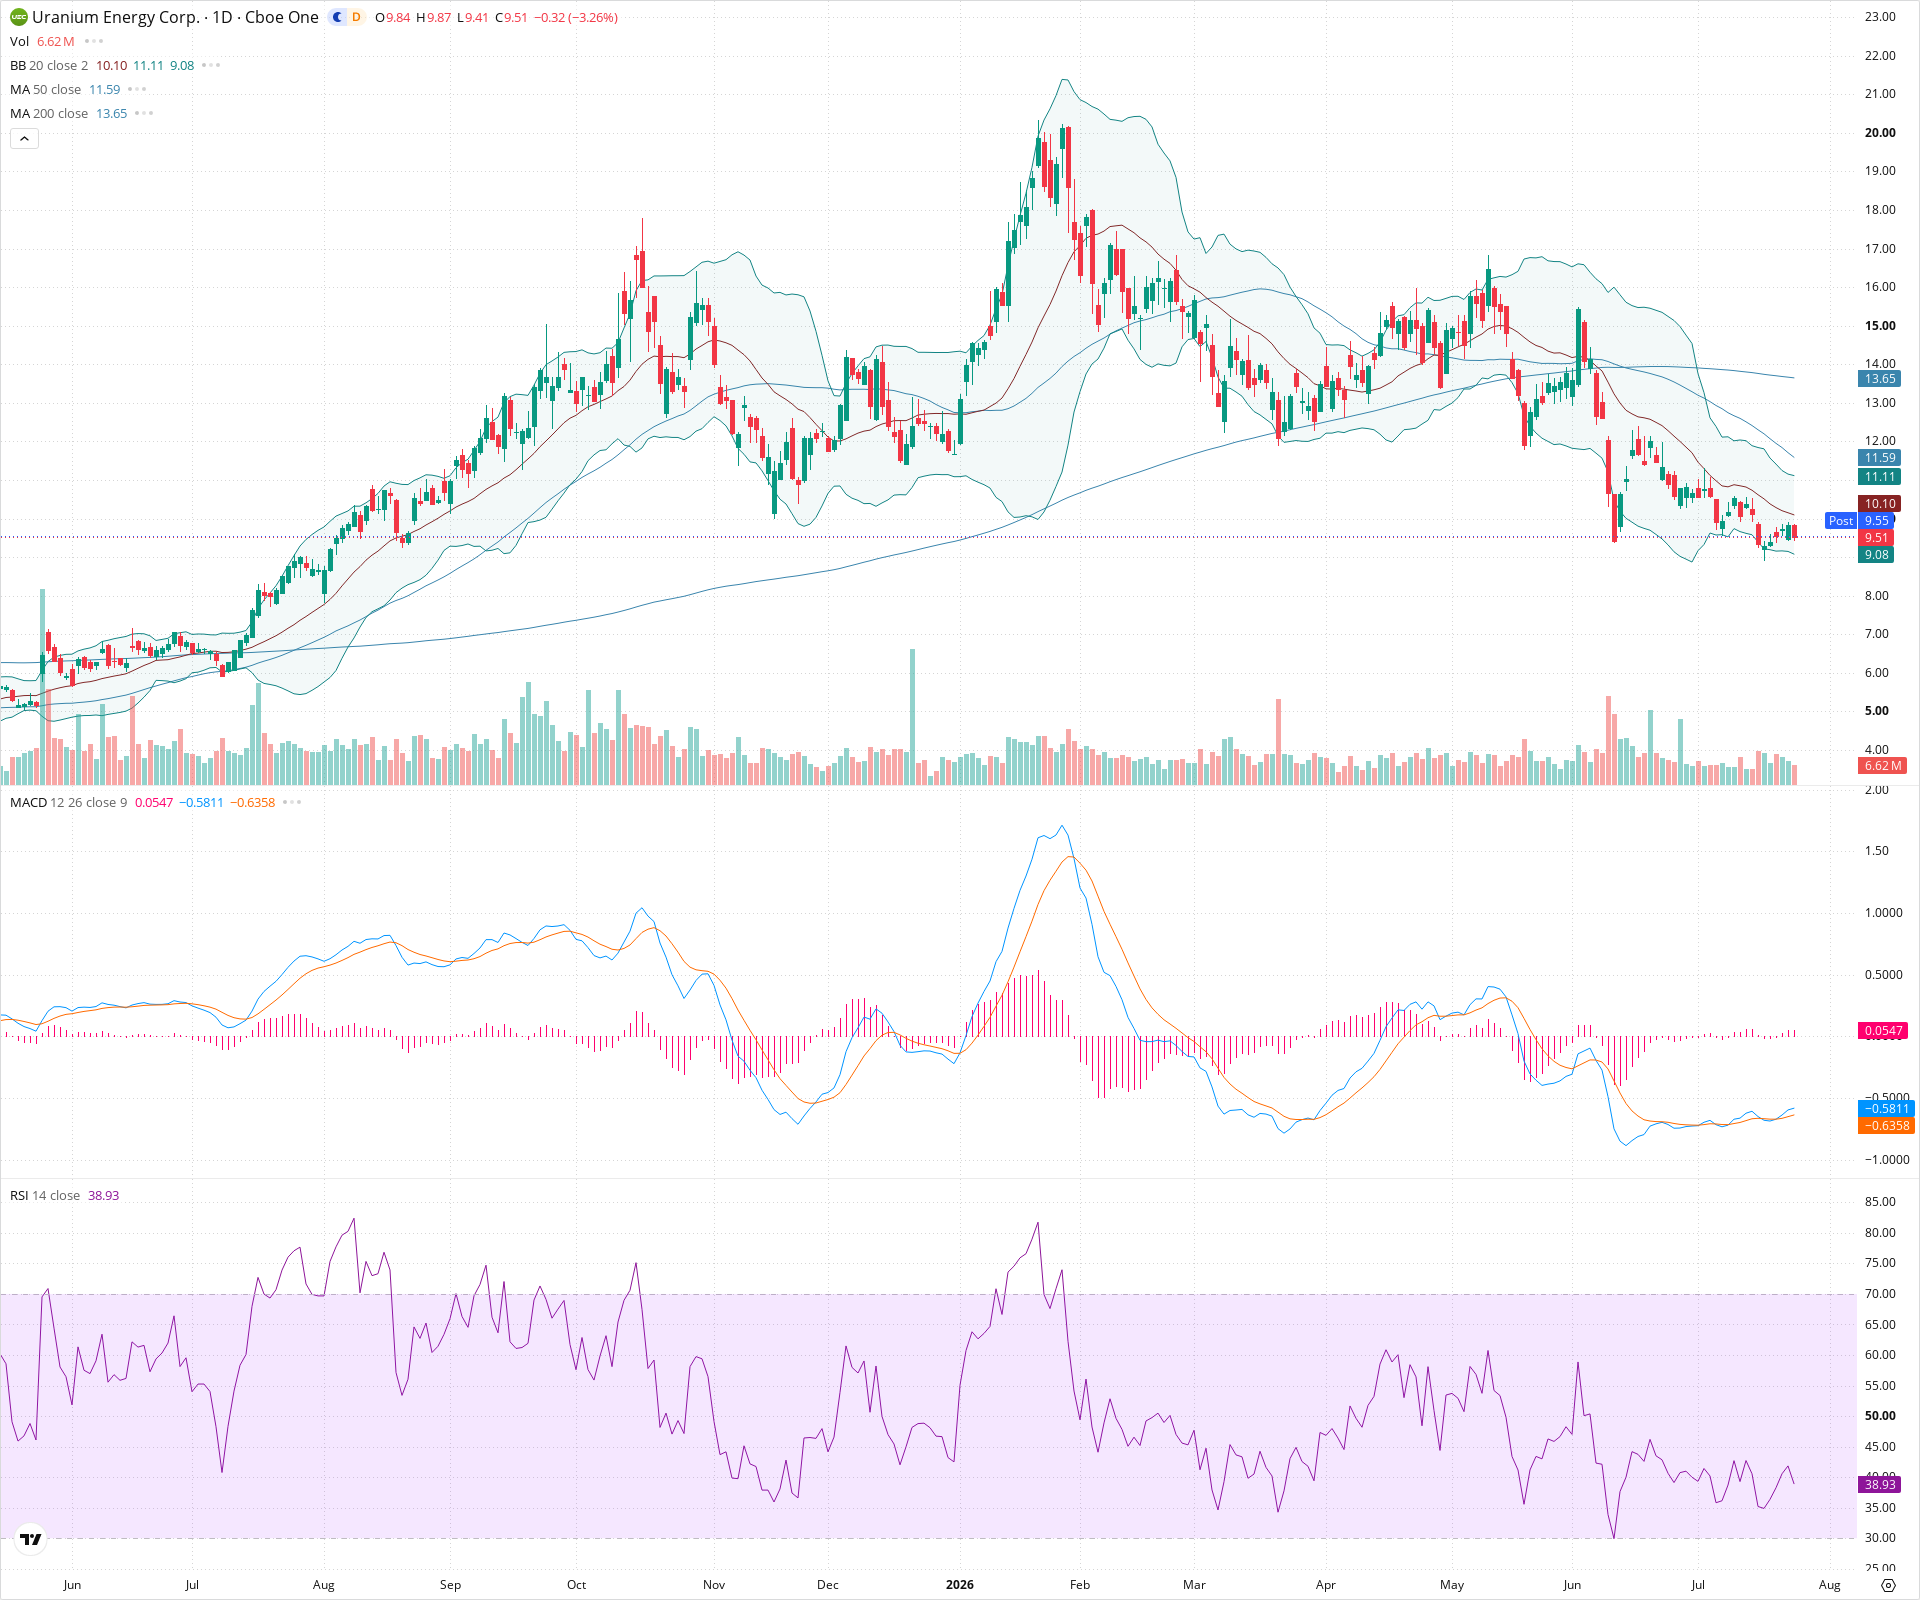
UEC remains firmly entrenched in a multi-month downtrend, defined by a clear sequence of lower highs and lower lows. The technical posture is heavily bearish, with price trading below all key moving averages (20, 50, and 200-day SMAs) following a recent death cross. While short-term momentum oscillators like the RSI are approaching oversold territory, there are currently no visual signs of an impending reversal, suggesting further downside pressure towards historical support zones is likely.
Included In Lists
Related Tickers of Interest
UEC Daily Chart
Sentiment
Short-term Sentiment (days to weeks): Bearish
Price is making new local lows, trading below a falling 20-day SMA, and riding the lower Bollinger Band. RSI is trending downwards towards oversold, indicating strong near-term downward momentum.
Long-term Sentiment (weeks to months): Bearish
The asset is in a sustained downtrend from its peak, characterized by a series of lower highs and lower lows. It is trading well below a downward-sloping 50-day SMA and has crossed below the 200-day SMA, with the 50-day SMA recently crossing under the 200-day SMA (Death Cross).
Report Metadata
- Timeframe: daily
- Generated at: 2026-07-24T21:15:32.699Z
- Model: gemini-3.1-pro-preview
Support Price Levels
| Level | Range | Strength | Notes |
|---|---|---|---|
| $9.00 | $8.80 - $9.20 | Strong | Historical consolidation zone and swing lows from July/August of the previous year visible on the left side of the chart. |
| $6.75 | $6.50 - $7.00 | Strong | Major prior swing low formation before the significant uptrend began. |
Resistance Price Levels
| Level | Range | Strength | Notes |
|---|---|---|---|
| $10.25 | $10.00 - $10.50 | Strong | Recent breakdown level of prior support consolidation, now acting as resistance. Aligns closely with the descending 20-day SMA. |
| $11.75 | $11.50 - $12.00 | Strong | Area of recent swing highs and structural resistance, coinciding with the falling 50-day SMA. |
Potential Chart Patterns in Formation
| Strength | Pattern | Signal | Target | Details |
|---|---|---|---|---|
| Strong | Downtrend Channel / Lower Highs & Lows | Bearish | $9.00 | The chart exhibits a clear pattern of lower highs and lower lows since the peak around 21.00. The recent break below the 10.00 support level confirms the continuation of this bearish market structure. |
Frequently Asked Questions about UEC
What is the current sentiment for UEC?
The short-term sentiment for UEC is currently Bearish because Price is making new local lows, trading below a falling 20-day SMA, and riding the lower Bollinger Band. RSI is trending downwards towards oversold, indicating strong near-term downward momentum.. The long-term trend is classified as Bearish.
What are the key support levels for UEC?
StockDips.AI has identified key support levels for UEC at $9.00 and $6.75. These levels may represent potential accumulation zones where buying interest could emerge.
Is UEC in a significant dip or a Value Dip right now?
UEC has a Value Score of 59/100. It is not currently flagged as a significant dip in the Top Dips list. It is not listed as a Value Dip because the long-term sentiment or value-score threshold does not qualify.
View the full interactive analysis on StockDips.AI.