GME Daily Technical Analysis
GameStop Corp.
Video game retailer that became a meme stock with significant retail following.
This is a historical daily technical analysis report for GME, generated on July 24, 2026 at 9:07 PM UTC.
GME Technical Analysis Summary
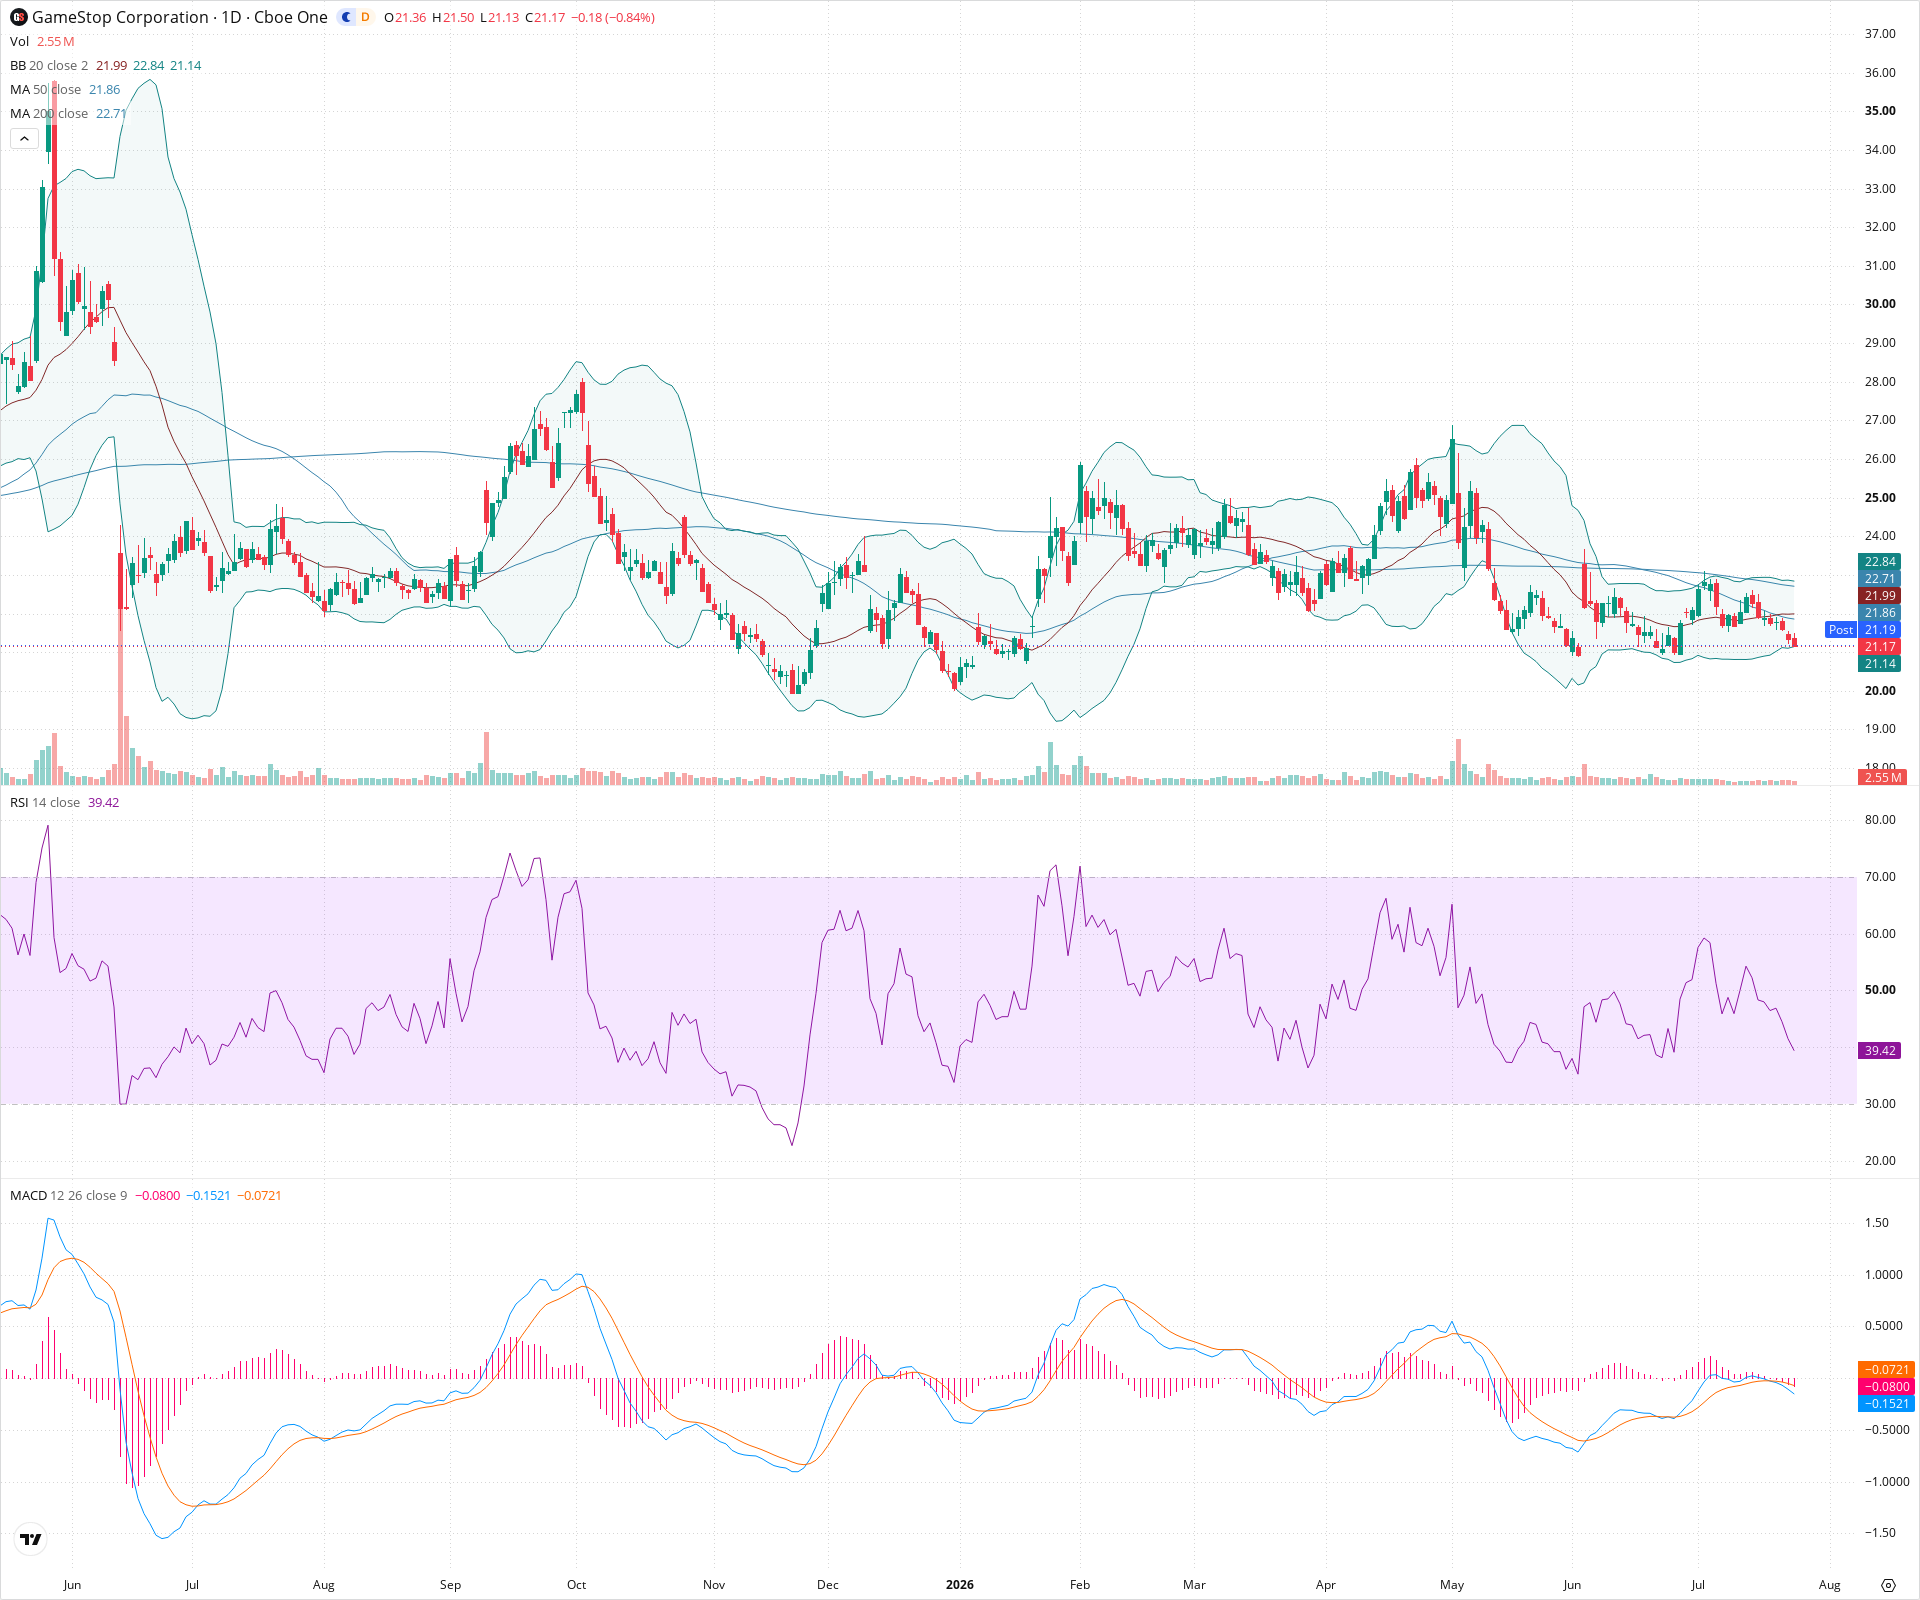
GME exhibits significant technical weakness on the daily chart, having fallen below all key moving averages (20, 50, and 200-day SMAs). Short-term momentum indicators like RSI and MACD confirm the current downward pressure, suggesting sellers are in control. For long-term investors, the inability to hold above the 200-day SMA indicates a lack of structural strength, making a retest of the lower support zones around $20 or lower a distinct possibility before any potential reversal.
Included In Lists
Related Tickers of Interest
Historical Report Navigation
Browse adjacent archived reports or jump back to the latest live analysis page.
GME Daily Chart
Sentiment
Short-term Sentiment (days to weeks): Bearish
Price is currently trending downward, riding the lower Bollinger Band, and is positioned below the 20, 50, and 200-day SMAs. RSI is falling below 40, and MACD shows negative momentum with the MACD line below the signal line.
Long-term Sentiment (weeks to months): Bearish
The broader trend is a wide, choppy range, but recent price action has failed to sustain a rally above the 200-day SMA. All major moving averages (20, 50, 200) are currently above the price, indicating a lack of long-term bullish control.
Report Metadata
- Timeframe: daily
- Generated at: Jul 24, 2026
- Model: gemini-3.1-pro-preview
Support Price Levels
| Level | Range | Strength | Notes |
|---|---|---|---|
| $20.50 | $20.00 - $21.00 | Strong | Psychological whole number level and significant consolidation zone from early in the year (Jan/Feb). |
| $19.15 | $18.80 - $19.50 | Strong | Major swing low area established in late Q4 of the previous year. |
Resistance Price Levels
| Level | Range | Strength | Notes |
|---|---|---|---|
| $22.30 | $21.80 - $22.80 | Strong | Immediate overhead resistance zone defined by the convergence of the 20-day, 50-day, and 200-day SMAs. |
| $25.00 | $24.50 - $25.50 | Strong | Recent swing high zone from the May rally. |
Potential Chart Patterns in Formation
| Strength | Pattern | Signal | Target | Details |
|---|---|---|---|---|
| Strong | Downtrend Channel | Bearish | $20.50 | Since the peak in late May, price has established a clear pattern of lower highs and lower lows, currently pressing against the lower boundary of this short-term descending channel. |
Frequently Asked Questions about GME
What is the current sentiment for GME?
The short-term sentiment for GME is currently Bearish because Price is currently trending downward, riding the lower Bollinger Band, and is positioned below the 20, 50, and 200-day SMAs. RSI is falling below 40, and MACD shows negative momentum with the MACD line below the signal line. The long-term trend is classified as Bearish.
What are the key support levels for GME?
StockDips.AI has identified key support levels for GME at $20.50 and $19.15. These levels may represent potential accumulation zones where buying interest could emerge.
Is GME in a significant dip or a Value Dip right now?
GME has a Value Score of 29/100. It is not currently flagged as a significant dip in the Top Dips list. It is not listed as a Value Dip because the long-term sentiment or value-score threshold does not qualify.
View the full interactive analysis on StockDips.AI.