LNG Weekly Technical Analysis
Cheniere Energy, Inc.
Leading U.S. LNG exporter operating major liquefaction facilities supplying natural gas to Europe and Asia.
LNG Technical Analysis Summary
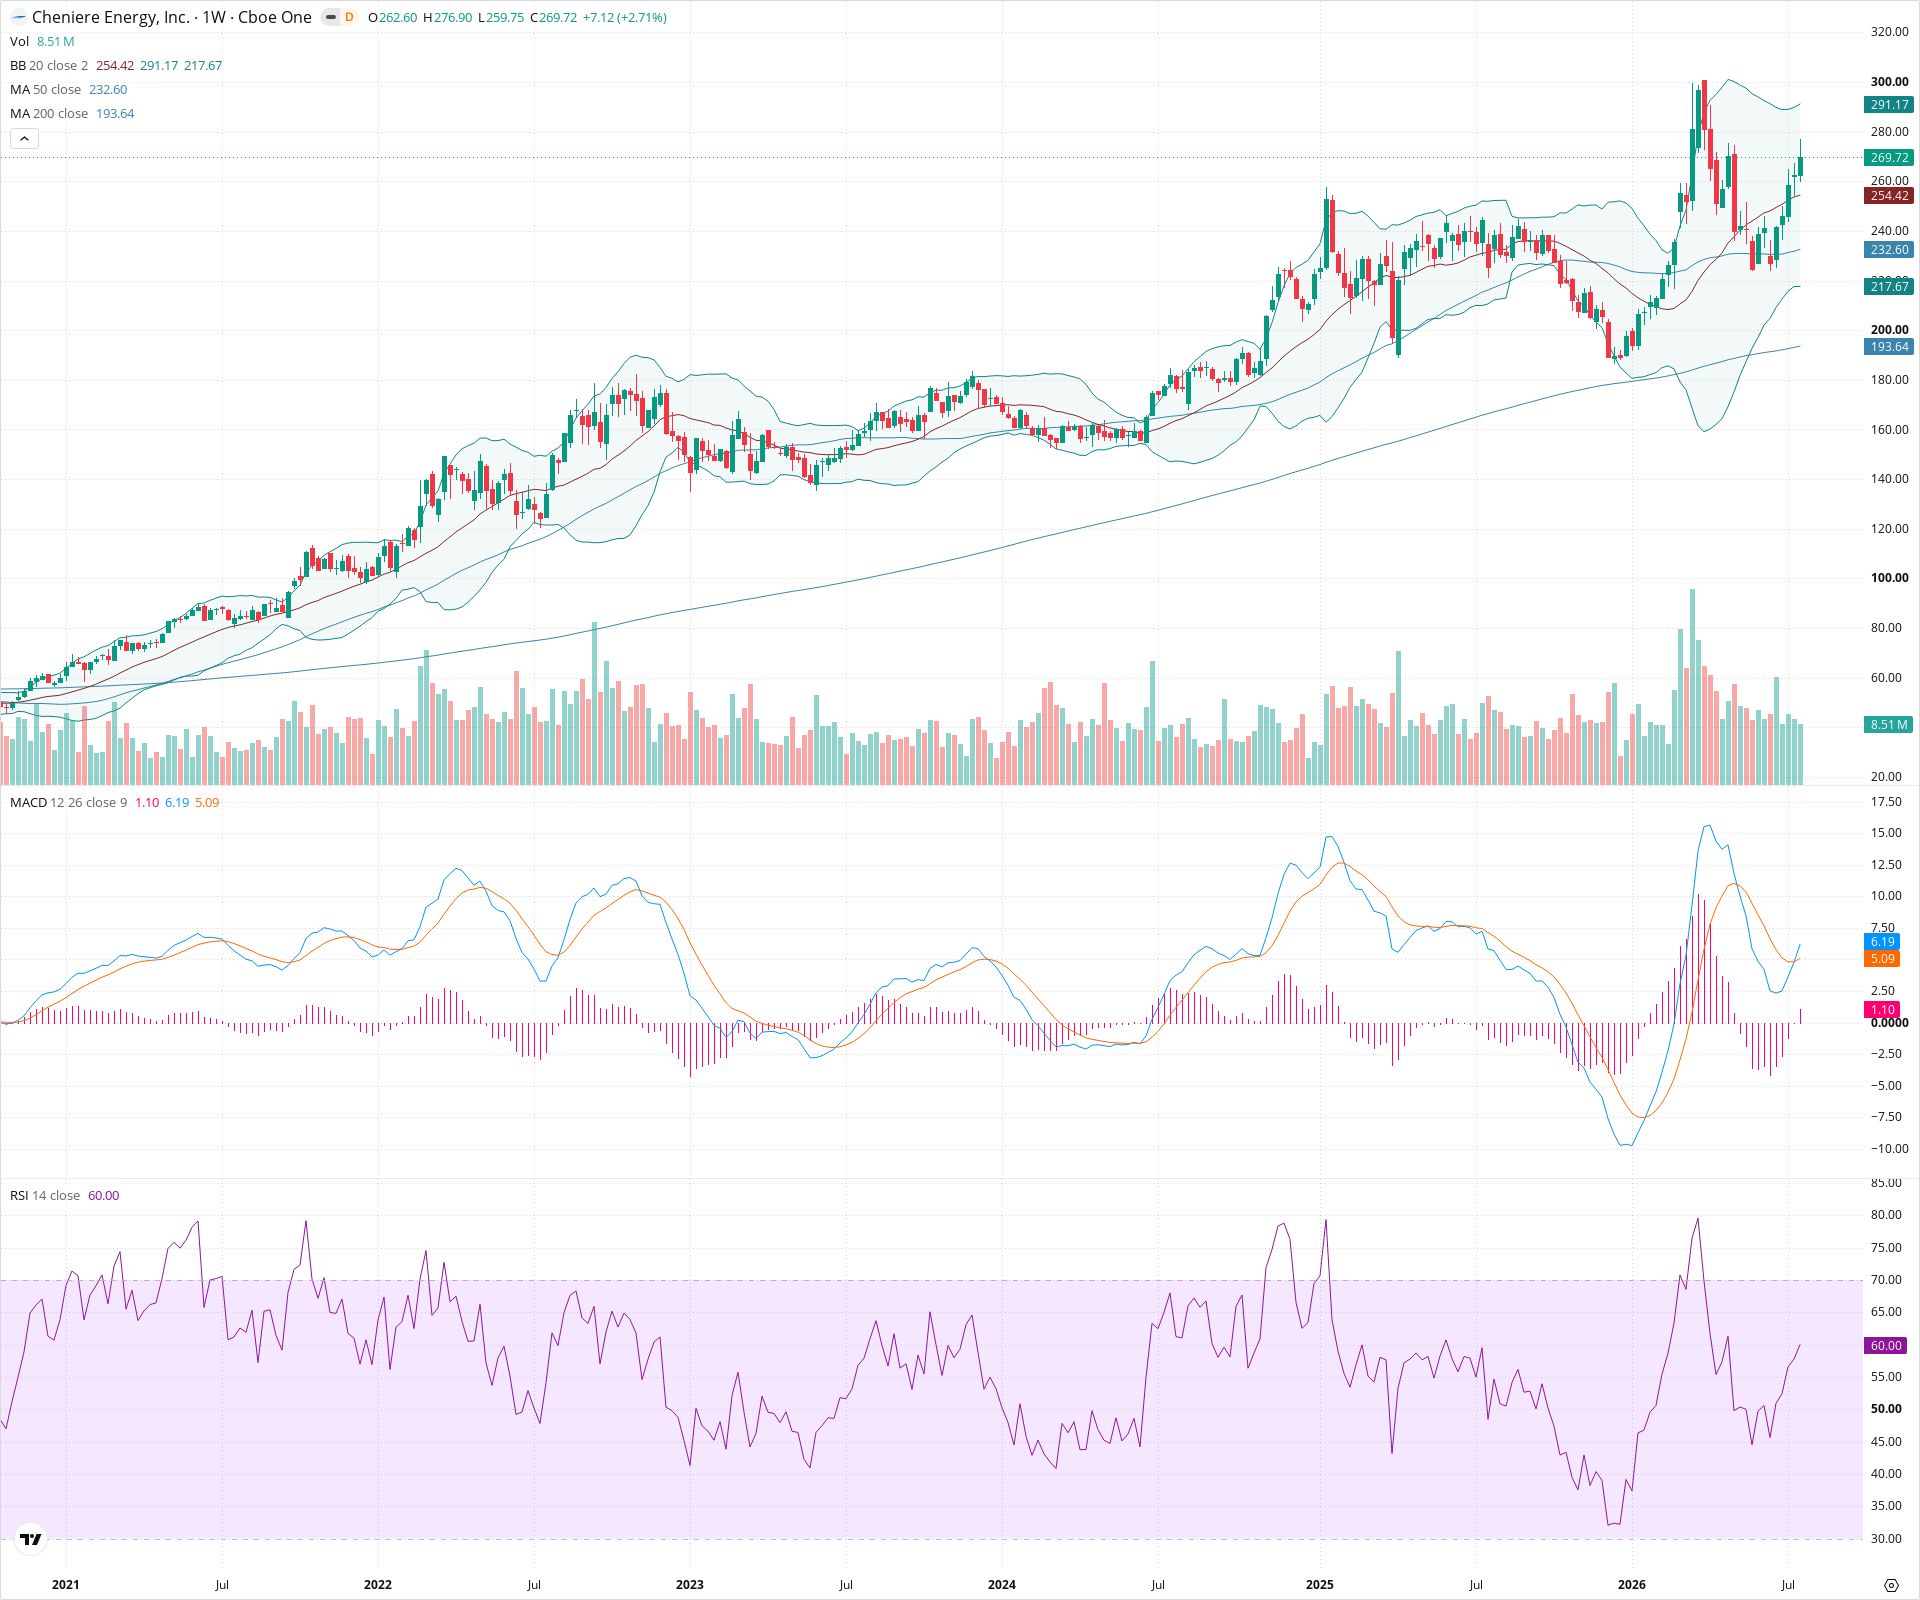
LNG is exhibiting a powerful resurgence following a significant structural correction. Long-term investors will note the primary uptrend remains firmly intact, with price holding well above a rising 200-week SMA. In the medium term, intense buying momentum has driven price through key moving averages, setting up a likely challenge of previous major highs near the 300 level.
Included In Lists
Related Tickers of Interest
LNG Weekly Chart
Sentiment
Short-term Sentiment (days to weeks): Bullish
Price is demonstrating strong upward momentum, having aggressively broken above the 20-week and 50-week SMAs. This is supported by rising RSI (currently at 60) and a bullish MACD crossover with expanding positive histogram.
Long-term Sentiment (weeks to months): Bullish
The primary multi-year trend remains clearly upward. The long-term 200-week SMA is steadily rising, and price action has formed a major structural higher low during the recent large correction, indicating ongoing macro demand.
Report Metadata
- Timeframe: weekly
- Generated at: 2026-07-25T09:09:21.699Z
- Model: gemini-3.1-pro-preview
Support Price Levels
| Level | Range | Strength | Notes |
|---|---|---|---|
| $247.50 | $240.00 - $255.00 | Weak | Near-term support zone formed by recent consolidation area and previous resistance before the latest breakout leg. |
| $205.00 | $195.00 - $215.00 | Strong | Major structural support zone established during extensive prior consolidation and acting as a base above the deepest correction lows. |
Resistance Price Levels
| Level | Range | Strength | Notes |
|---|---|---|---|
| $297.50 | $290.00 - $305.00 | Strong | The primary overhead resistance zone, representing the cluster of previous major multi-year peaks (all-time highs on this chart). |
Potential Chart Patterns in Formation
| Strength | Pattern | Signal | Target | Details |
|---|---|---|---|---|
| Strong | V-Bottom Reversal | Bullish | N/A | An aggressive, nearly uninterrupted recovery from deep correction lows, indicating a strong influx of buying pressure and a decisive shift back to bullish momentum. |
Frequently Asked Questions about LNG
What is the current sentiment for LNG?
The short-term sentiment for LNG is currently Bullish because Price is demonstrating strong upward momentum, having aggressively broken above the 20-week and 50-week SMAs. This is supported by rising RSI (currently at 60) and a bullish MACD crossover with expanding positive histogram.. The long-term trend is classified as Bullish.
What are the key support levels for LNG?
StockDips.AI has identified key support levels for LNG at $247.50 and $205.00. These levels may represent potential accumulation zones where buying interest could emerge.
Is LNG in a significant dip or a Value Dip right now?
LNG has a Value Score of 37/100. It is not currently flagged as a significant dip in the Top Dips list. It is not listed as a Value Dip because the long-term sentiment or value-score threshold does not qualify.
View the full interactive analysis on StockDips.AI.