MRNA Weekly Technical Analysis
Moderna Inc
Moderna is an American biotechnology company that specializes in messenger RNA (mRNA) technology to create vaccines and therapeutic medicines.
MRNA Technical Analysis Summary
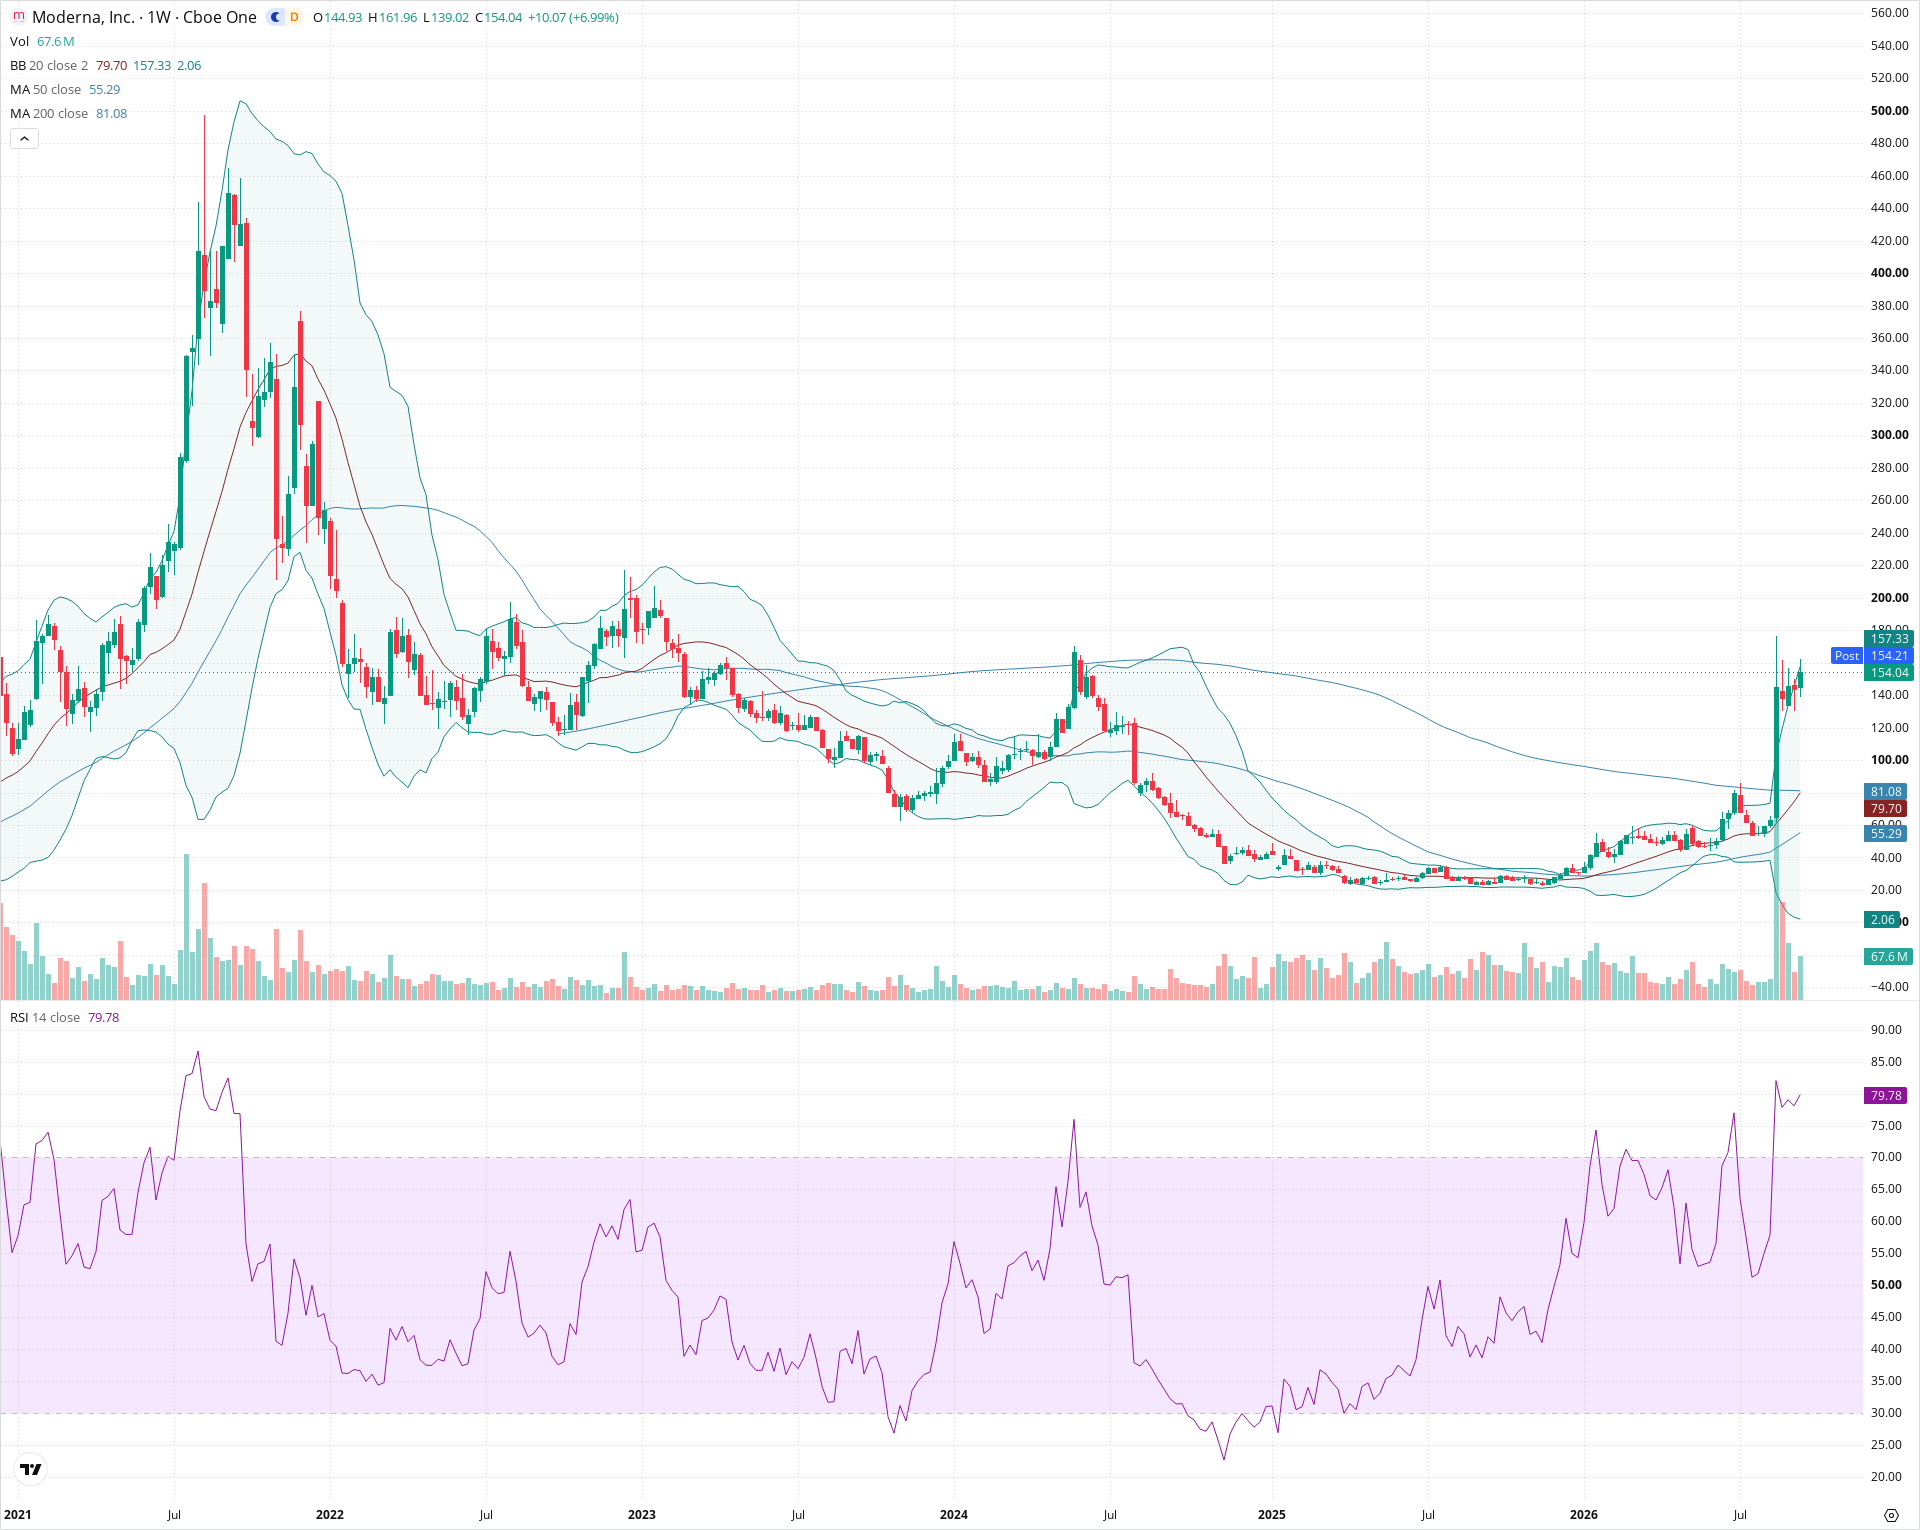
MRNA has completed a decisive multi-year accumulation base, breaking violently above both its 50-week and 200-week moving averages with massive volume expansion. While the weekly RSI (79.78) and proximity to the upper Bollinger Band indicate short-term overbought conditions, the structural long-term trend has decisively reversed to bullish. Key overhead resistance sits between $160 and $175, while pullbacks towards the $135–$145 region or the $75–$85 moving average confluence represent critical support areas.
Included In Lists
Related Tickers of Interest
MRNA Weekly Chart
Sentiment
Short-term Sentiment (days to weeks): Bullish
Price has experienced a powerful momentum breakout above the 50-week and 200-week moving averages on elevated volume, currently holding gains near the top of the upper Bollinger Band.
Long-term Sentiment (weeks to months): Bullish
The multi-year base formed between $20 and $40 has definitively broken upward, reclaiming both the 50-week and 200-week SMAs with strong weekly closes above long-term structural resistance.
Report Metadata
- Timeframe: weekly
- Generated at: 2026-09-18T21:05:47.030Z
- Model: gemini-3.8-flash
Support Price Levels
| Level | Range | Strength | Notes |
|---|---|---|---|
| $140.00 | $135.00 - $145.00 | Moderate | Recent weekly consolidation base and current candle low zone. |
| $80.00 | $75.00 - $85.00 | Strong | Confluence of the 200-week SMA (81.08), the 20-week SMA (79.70), and the prior major structural breakout level. |
| $54.00 | $50.00 - $58.00 | Moderate | Alignment with the rising 50-week SMA (55.29) and base expansion zone. |
Resistance Price Levels
| Level | Range | Strength | Notes |
|---|---|---|---|
| $167.50 | $160.00 - $175.00 | Strong | Current weekly wick high at 161.96, upper Bollinger Band (157.33), and the major mid-2024 swing high. |
| $217.50 | $210.00 - $225.00 | Moderate | Major structural swing high from early 2023 consolidation. |
Potential Chart Patterns in Formation
| Strength | Pattern | Signal | Target | Details |
|---|---|---|---|---|
| Strong | Rounding Bottom / Base Breakout | Bullish | $215.00 | Multi-year accumulation base formed across 2024–2026 between $20 and $45, followed by an aggressive high-volume breakout reclaiming long-term moving averages. |
| Strong | Bullish Momentum Continuation | Bullish | $175.00 | Explosive multi-week impulse off the base through the 200-week SMA, supported by strong volume and elevated RSI above 70. |
Frequently Asked Questions about MRNA
What is the current sentiment for MRNA?
The short-term sentiment for MRNA is currently Bullish because Price has experienced a powerful momentum breakout above the 50-week and 200-week moving averages on elevated volume, currently holding gains near the top of the upper Bollinger Band.. The long-term trend is classified as Bullish.
What are the key support levels for MRNA?
StockDips.AI has identified key support levels for MRNA at $140.00 and $80.00. These levels may represent potential accumulation zones where buying interest could emerge.
Is MRNA in a significant dip or a Value Dip right now?
MRNA has a Value Score of 48/100. It is not currently flagged as a significant dip in the Top Dips list. It is not listed as a Value Dip because the long-term sentiment or value-score threshold does not qualify.
View the full interactive analysis on StockDips.AI.