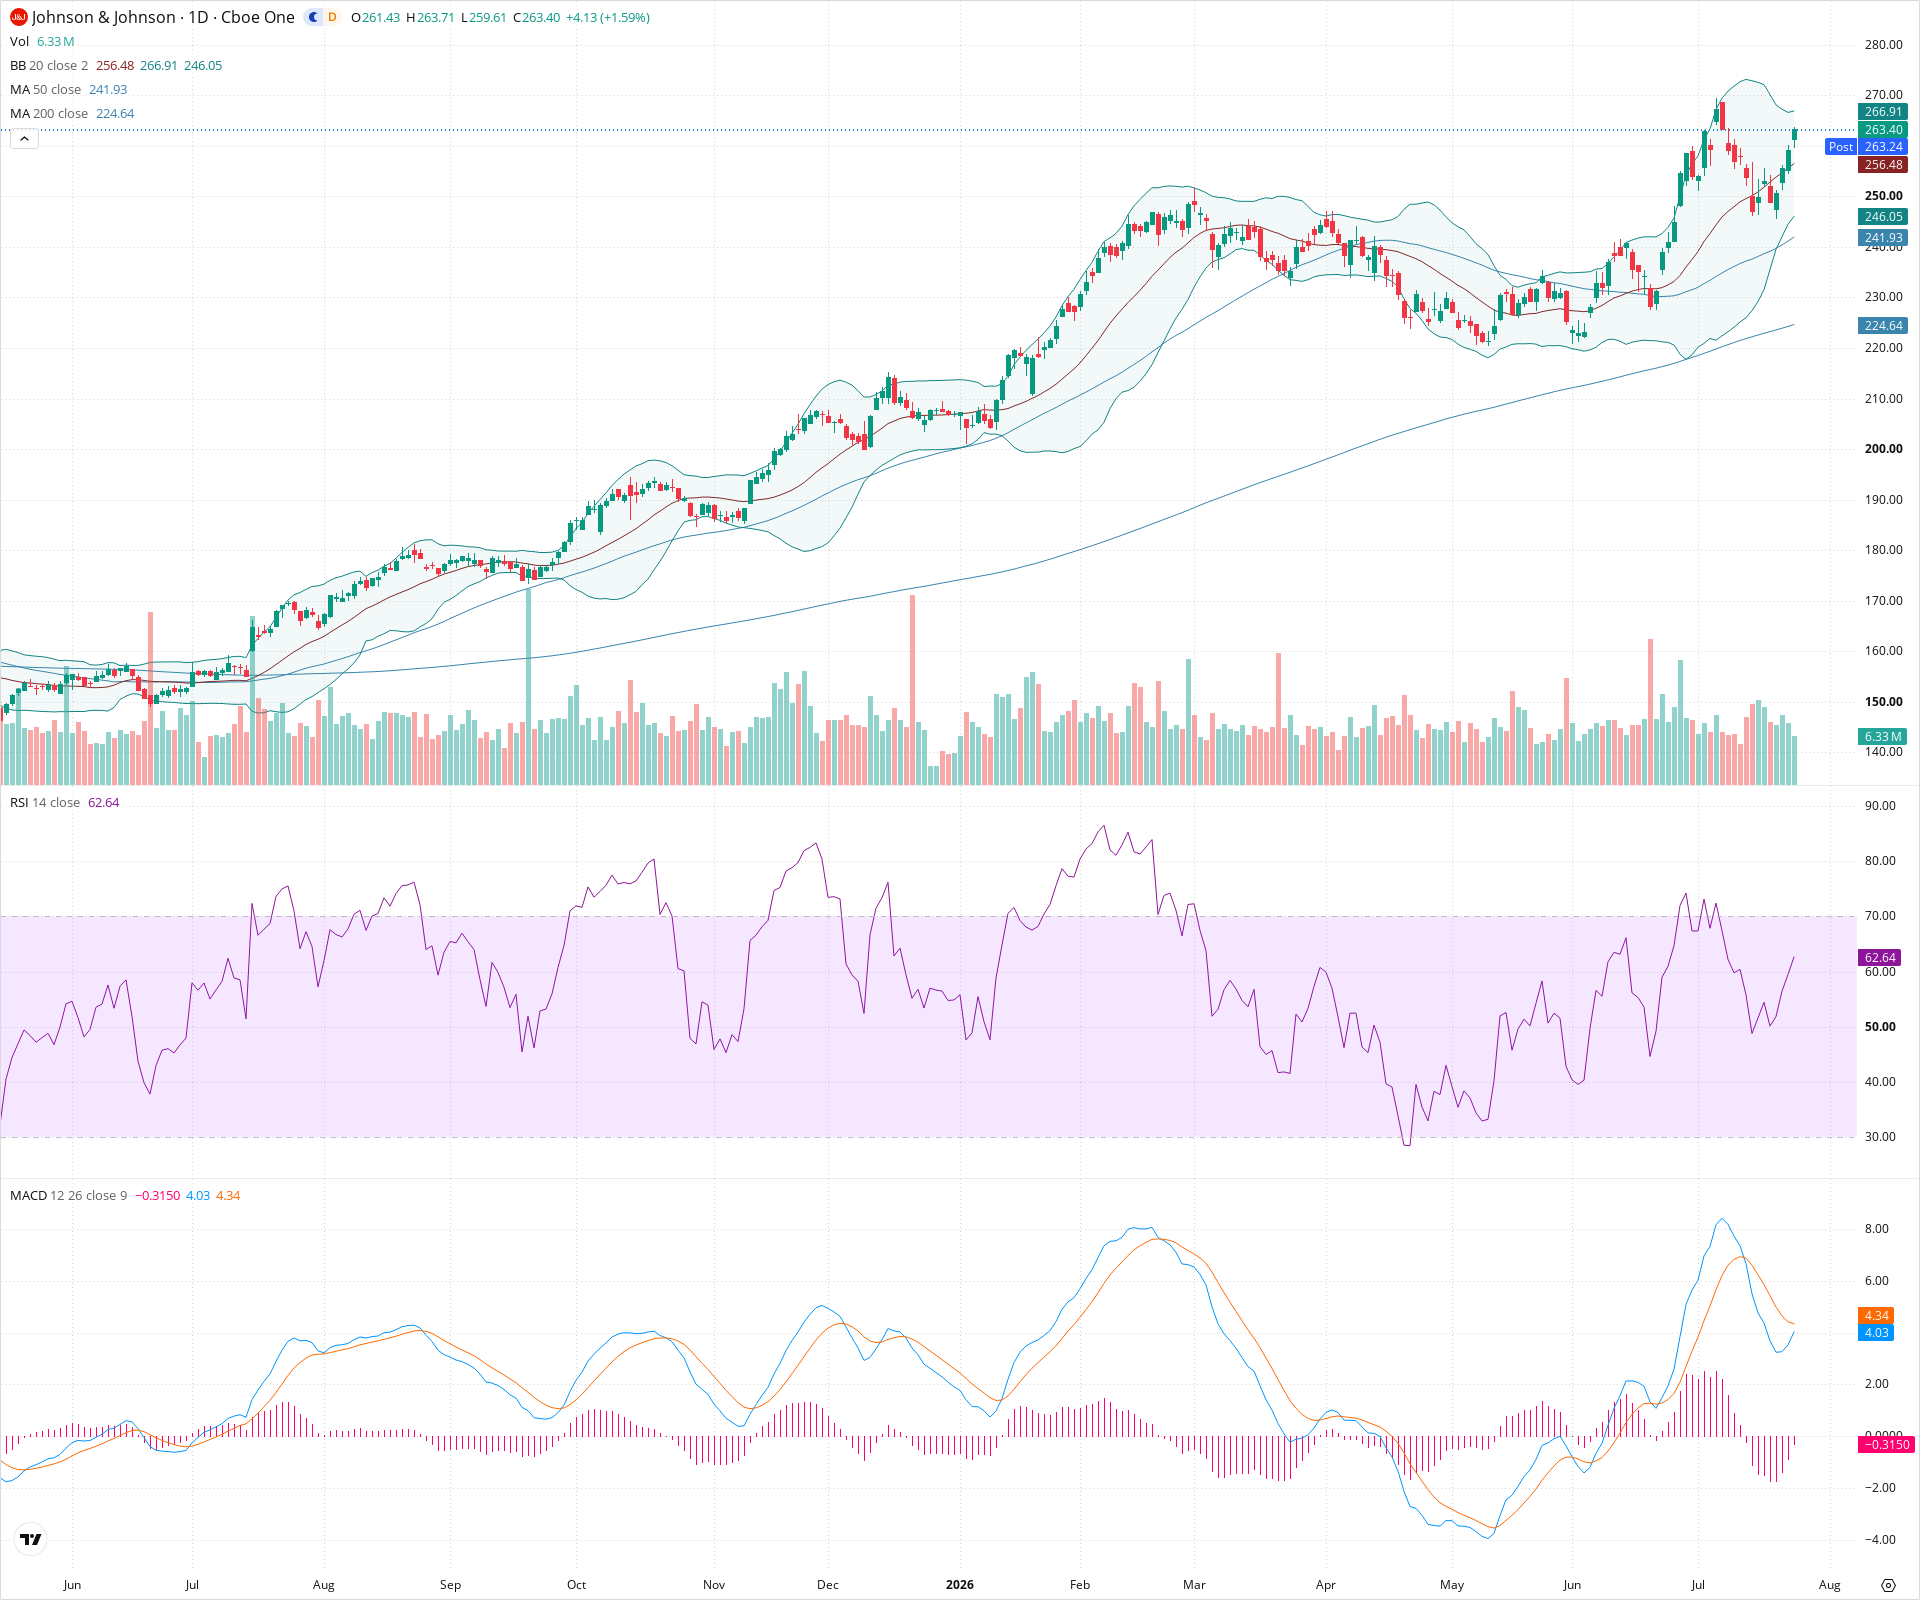
JNJ Daily Technical Analysis
Johnson & Johnson
Global healthcare giant in pharma, medical devices, and consumer health
JNJ Technical Analysis Summary
JNJ demonstrates a highly robust long-term technical profile, maintaining a steady uptrend well above its key 50-day and 200-day moving averages. A recent sharp but healthy correction found aggressive buying interest near the 20-day SMA. With short-term momentum indicators like RSI and the MACD histogram turning favorable, the chart favors a continuation of the upward move to challenge recent highs.
Included In Lists
Related Tickers of Interest
JNJ Daily Chart
Sentiment
Short-term Sentiment (days to weeks): Bullish
Price has bounced strongly off the 20-day moving average area with consecutive bullish candles. RSI is hooking back upward from the midrange, and the MACD negative histogram is contracting, suggesting a shift back to positive momentum.
Long-term Sentiment (weeks to months): Bullish
The chart shows a textbook long-term uptrend with a sequence of higher highs and higher lows. The price is trading significantly above both the 50-day and 200-day SMAs, which are both sloping upward.
Report Metadata
- Timeframe: daily
- Generated at: 2026-07-24T21:13:12.700Z
- Model: gemini-3.1-pro-preview
Support Price Levels
| Level | Range | Strength | Notes |
|---|---|---|---|
| $247.50 | $245.00 - $250.00 | Strong | Recent swing low that acted as a strong bounce level, coinciding roughly with the 20-day SMA. |
| $240.00 | $238.00 - $242.00 | Strong | Zone around the rising 50-day SMA and a prior area of price consolidation. |
| $222.50 | $220.00 - $225.00 | Strong | Major structural support zone located near the 200-day SMA. |
Resistance Price Levels
| Level | Range | Strength | Notes |
|---|---|---|---|
| $267.50 | $265.00 - $270.00 | Weak | Immediate resistance area around the upper Bollinger Band. |
| $277.50 | $275.00 - $280.00 | Strong | The recent major swing high and peak before the latest pullback. |
Potential Chart Patterns in Formation
| Strength | Pattern | Signal | Target | Details |
|---|---|---|---|---|
| Strong | Bullish Continuation / Flag | Bullish | $278.00 | After a strong impulsive move up to ~278, the price formed a sharp, corrective pullback. The recent bounce suggests this was a continuation pattern (like a flag), and the primary uptrend is resuming. |
Frequently Asked Questions about JNJ
What is the current sentiment for JNJ?
The short-term sentiment for JNJ is currently Bullish because Price has bounced strongly off the 20-day moving average area with consecutive bullish candles. RSI is hooking back upward from the midrange, and the MACD negative histogram is contracting, suggesting a shift back to positive momentum.. The long-term trend is classified as Bullish.
What are the key support levels for JNJ?
StockDips.AI has identified key support levels for JNJ at $247.50 and $240.00. These levels may represent potential accumulation zones where buying interest could emerge.
Is JNJ in a significant dip or a Value Dip right now?
JNJ has a Value Score of 21/100. It is not currently flagged as a significant dip in the Top Dips list. It is not listed as a Value Dip because the long-term sentiment or value-score threshold does not qualify.
View the full interactive analysis on StockDips.AI.