NVO Daily Technical Analysis
Novo Nordisk A/S
Danish pharma specializing in diabetes and weight-loss drugs such as Ozempic and Wegovy.
NVO Technical Analysis Summary
NVO is demonstrating a strong technical turnaround, transitioning from a prolonged downtrend into a new accumulation and markup phase characterized by a rounding bottom. The stock has successfully reclaimed key moving averages, and the impending 50/200-day SMA Golden Cross suggests a significant positive shift in long-term momentum. As long as price maintains structure above the 46-47 support cluster, the technical bias remains constructive for further upside.
Included In Lists
Related Tickers of Interest
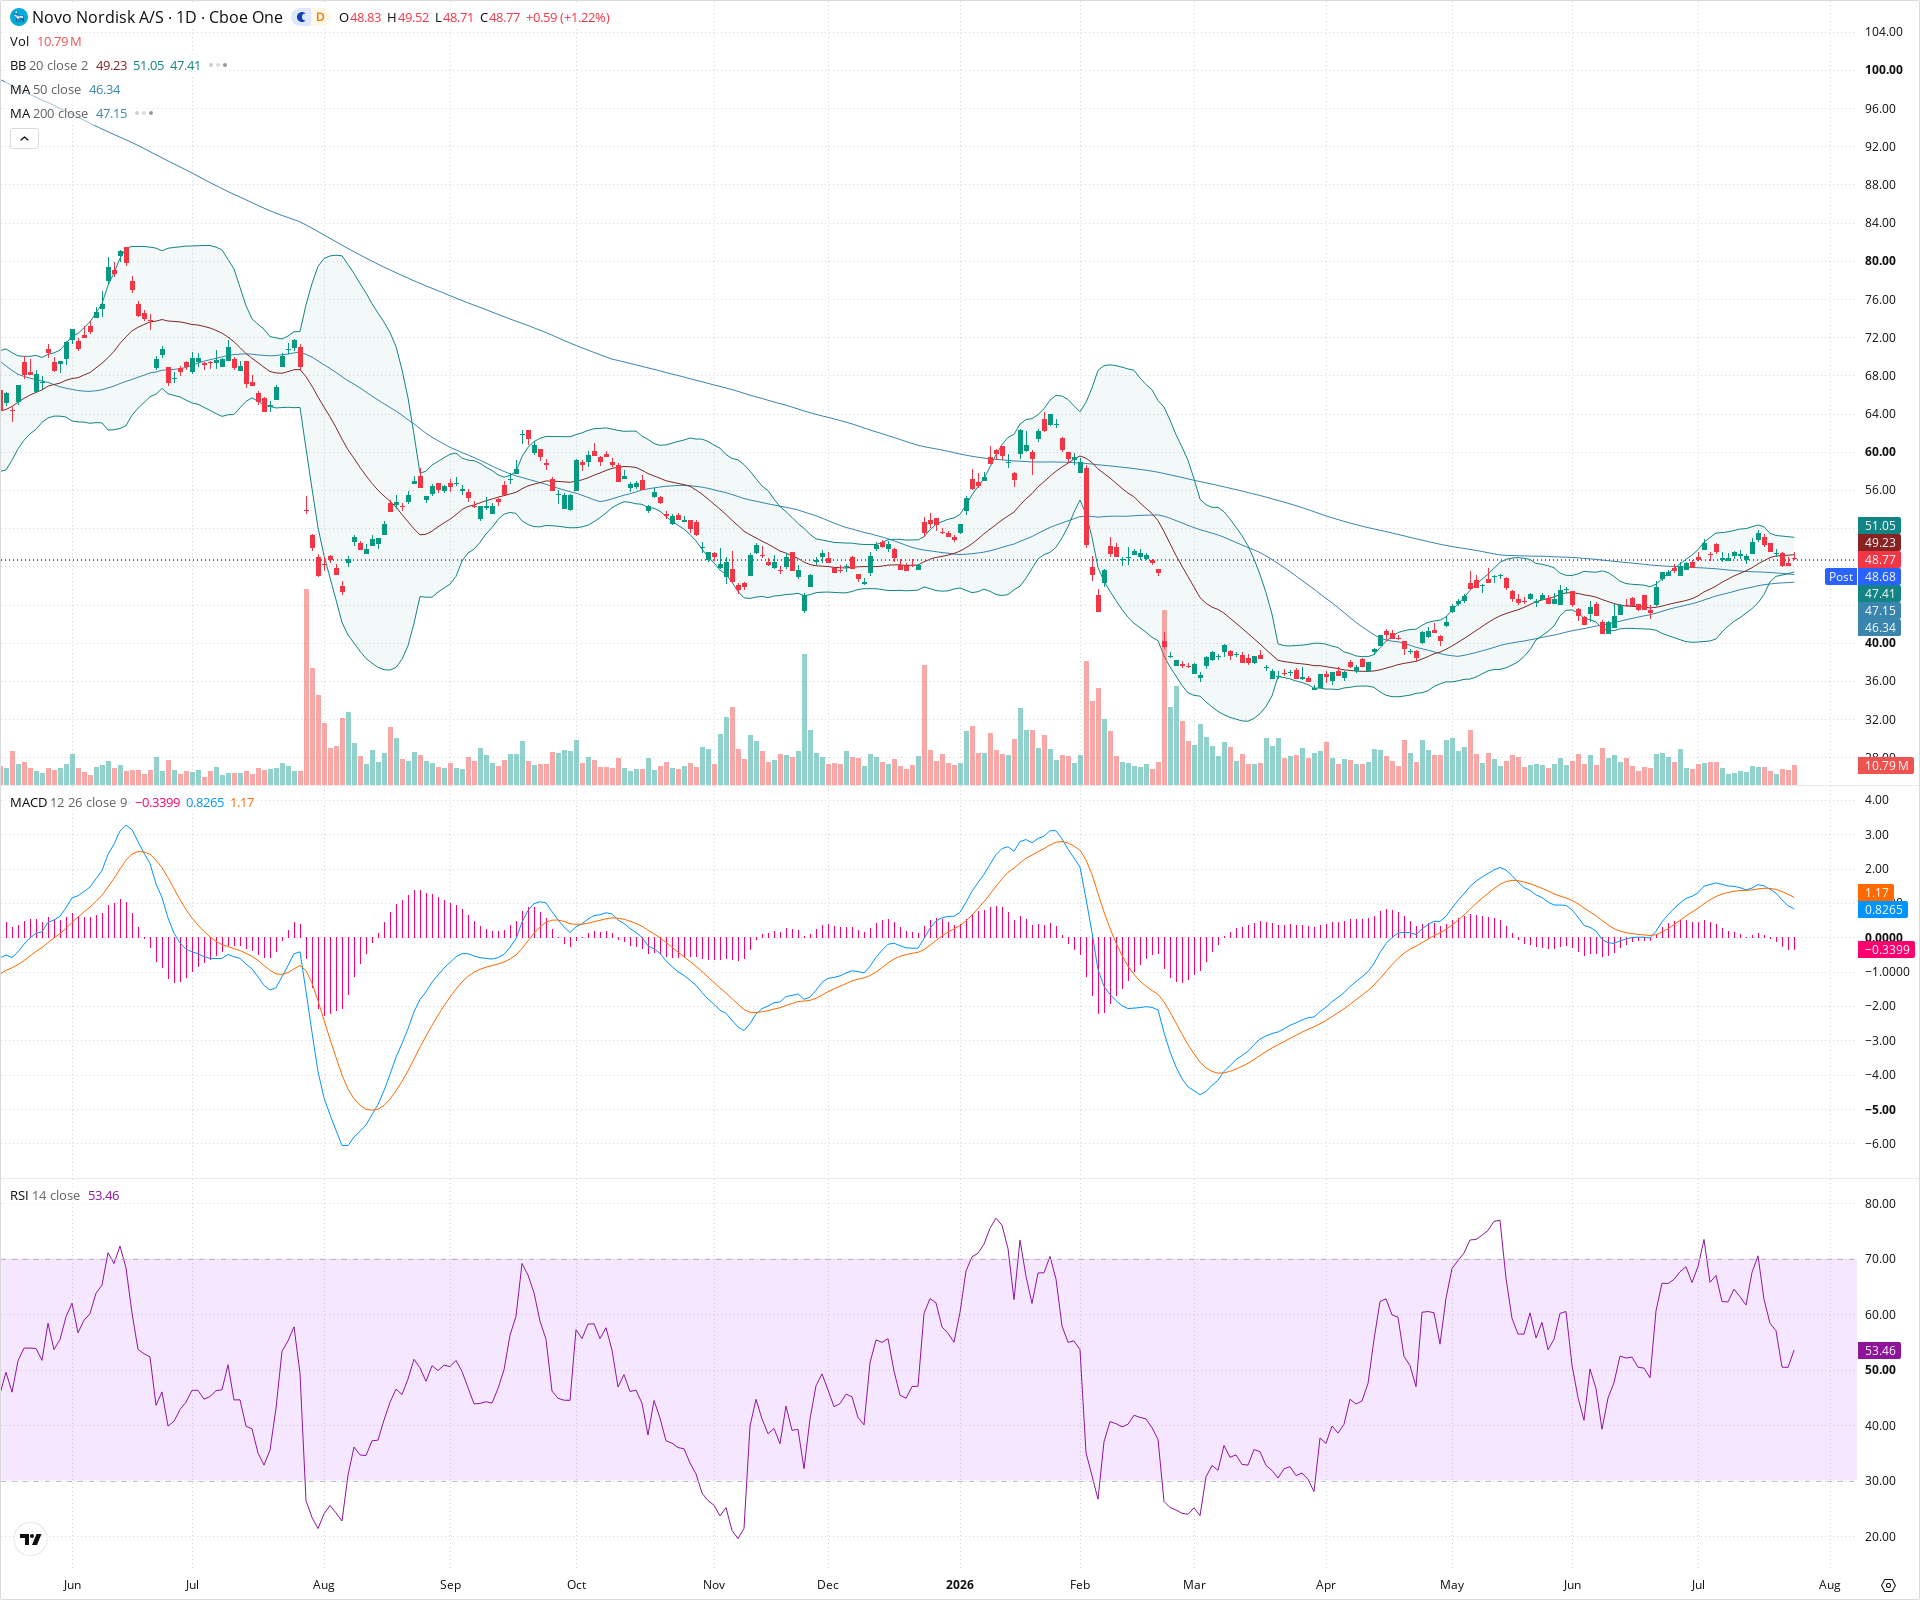
NVO Daily Chart
Sentiment
Short-term Sentiment (days to weeks): Bullish
Price is maintaining a steady uptrend, consistently forming higher highs and higher lows. It is trading above the rising 20-day and 50-day SMAs. The MACD line remains above the signal line and the zero line, confirming upward momentum, though the histogram is showing slight contraction.
Long-term Sentiment (weeks to months): Bullish
The chart shows a major structural reversal. After a steep decline, price formed a long consolidation base and has now broken upwards, reclaiming the 200-day SMA. The 50-day SMA is rising sharply and appears to be on the verge of crossing above the 200-day SMA, which would trigger a long-term bullish 'Golden Cross' signal.
Report Metadata
- Timeframe: daily
- Generated at: 2026-07-24T21:11:46.499Z
- Model: gemini-3.1-pro-preview
Support Price Levels
| Level | Range | Strength | Notes |
|---|---|---|---|
| $46.90 | $46.30 - $47.50 | Strong | A critical confluence zone containing the rising 50-day SMA, the 200-day SMA, and the 20-day SMA, acting as dynamic support for the current uptrend. |
| $41.00 | $40.00 - $42.00 | Strong | A significant structural swing low area formed prior to the recent bullish leg up. |
| $37.00 | $36.00 - $38.00 | Strong | The major chart bottom and long-term consolidation floor. |
Resistance Price Levels
| Level | Range | Strength | Notes |
|---|---|---|---|
| $50.75 | $50.00 - $51.50 | Weak | Immediate overhead resistance near psychological round numbers and the upper Bollinger Band, where price has recently paused. |
| $60.00 | $58.00 - $62.00 | Strong | A major previous lower high formed during a relief rally after the initial large sell-off on the left side of the chart. |
Potential Chart Patterns in Formation
| Strength | Pattern | Signal | Target | Details |
|---|---|---|---|---|
| Strong | Rounding Bottom | Bullish | N/A | The macro structure of the chart shows a long, U-shaped recovery from a severe downtrend, indicating a slow but steady shift from distribution to accumulation. |
| Strong | Golden Cross (Developing) | Bullish | N/A | The 50-day SMA is rising steeply towards the flattening 200-day SMA. A crossover appears imminent, which is a classic long-term bullish trend continuation signal. |
Frequently Asked Questions about NVO
What is the current sentiment for NVO?
The short-term sentiment for NVO is currently Bullish because Price is maintaining a steady uptrend, consistently forming higher highs and higher lows. It is trading above the rising 20-day and 50-day SMAs. The MACD line remains above the signal line and the zero line, confirming upward momentum, though the histogram is showing slight contraction.. The long-term trend is classified as Bullish.
What are the key support levels for NVO?
StockDips.AI has identified key support levels for NVO at $46.90 and $41.00. These levels may represent potential accumulation zones where buying interest could emerge.
Is NVO in a significant dip or a Value Dip right now?
NVO has a Value Score of 51/100. It is not currently flagged as a significant dip in the Top Dips list. It is not listed as a Value Dip because the long-term sentiment or value-score threshold does not qualify.
View the full interactive analysis on StockDips.AI.