OKLO Daily Technical Analysis
Oklo Inc
Advanced nuclear energy company developing small, fast-spectrum nuclear reactors designed to provide long-duration, carbon-free power for data centers, industrial users, and remote locations. Known for its focus on AI-driven energy demand and high-profile backers.
OKLO Technical Analysis Summary
The technical picture for OKLO is overwhelmingly bearish across all timeframes visible on this chart. Following a dramatic top, the asset has established a relentless downtrend, currently trading beneath a decisively bearish alignment of the 20, 50, and 200-day SMAs. With short-term momentum indicators accelerating downward and price exploring new recent lows, there is no visible technical evidence to suggest a trend reversal is imminent, warranting extreme caution for long-term investors.
Included In Lists
Related Tickers of Interest
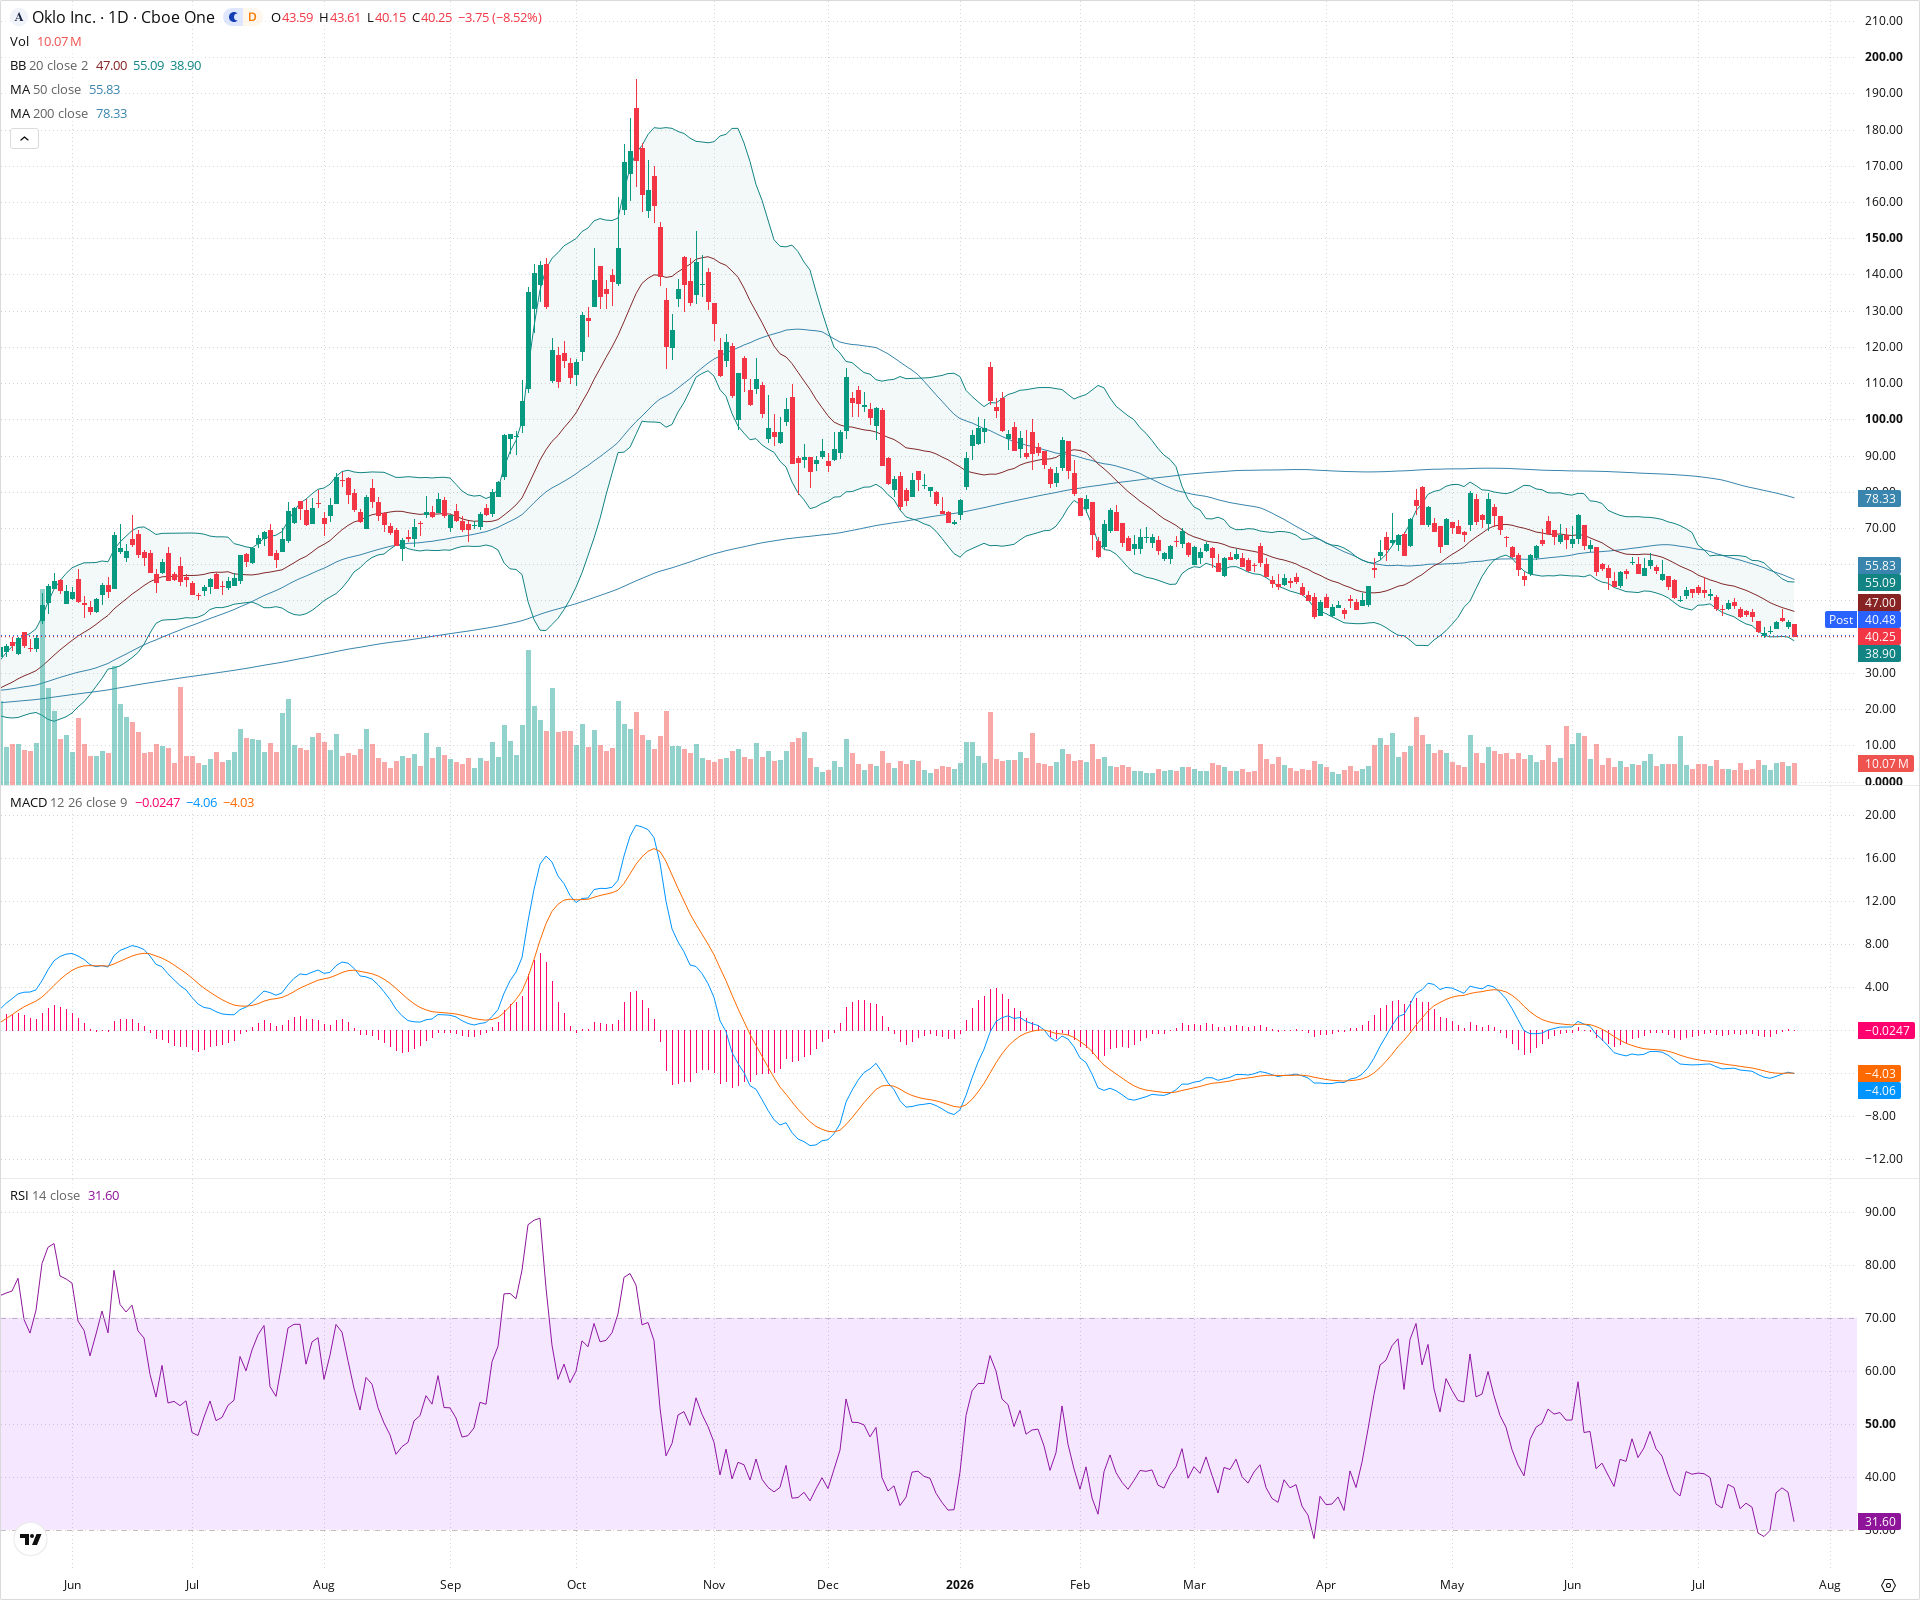
OKLO Daily Chart
Sentiment
Short-term Sentiment (days to weeks): Bearish
Price is aggressively making new recent lows, riding the lower Bollinger Band, and remains below steep downward sloping short-term moving averages (20 and 50 SMAs). Negative momentum is confirmed by an expanding MACD histogram below the zero line and an RSI dropping steeply towards oversold levels.
Long-term Sentiment (weeks to months): Bearish
The dominant macro structure is a severe, prolonged downtrend following a massive peak. The price is trading significantly below a declining 200-day SMA, with all moving averages exhibiting a strong bearish alignment (20 < 50 < 200).
Report Metadata
- Timeframe: daily
- Generated at: 2026-07-24T21:05:18.026Z
- Model: gemini-3.1-pro-preview
Support Price Levels
| Level | Range | Strength | Notes |
|---|---|---|---|
| $39.00 | $38.00 - $40.00 | Weak | Immediate psychological and structural support area being tested based on the current lower wick and proximity to the lower Bollinger Band. |
| $30.00 | $28.00 - $32.00 | Strong | Historical consolidation and chop zone visible on the far left of the chart before the major run-up, likely to act as a major floor if the current descent continues. |
Resistance Price Levels
| Level | Range | Strength | Notes |
|---|---|---|---|
| $47.00 | $46.00 - $48.00 | Strong | Aligns with the declining 20-day SMA and recent minor swing highs that will act as immediate dynamic resistance. |
| $55.50 | $54.00 - $57.00 | Strong | Significant overhead resistance zone defined by the declining 50-day SMA and a previous horizontal consolidation area that acted as support before breaking down. |
Potential Chart Patterns in Formation
| Strength | Pattern | Signal | Target | Details |
|---|---|---|---|---|
| Strong | Sustained Downtrend / Channel | Bearish | N/A | A relentless sequence of lower highs and lower lows characterizing price action for many months, showing no structural signs of reversal. |
Frequently Asked Questions about OKLO
What is the current sentiment for OKLO?
The short-term sentiment for OKLO is currently Bearish because Price is aggressively making new recent lows, riding the lower Bollinger Band, and remains below steep downward sloping short-term moving averages (20 and 50 SMAs). Negative momentum is confirmed by an expanding MACD histogram below the zero line and an RSI dropping steeply towards oversold levels.. The long-term trend is classified as Bearish.
What are the key support levels for OKLO?
StockDips.AI has identified key support levels for OKLO at $39.00 and $30.00. These levels may represent potential accumulation zones where buying interest could emerge.
Is OKLO in a significant dip or a Value Dip right now?
OKLO has a Value Score of 84/100. It is currently flagged as a significant dip in the Top Dips list. It is not listed as a Value Dip because the long-term sentiment or value-score threshold does not qualify.
View the full interactive analysis on StockDips.AI.