OKLO Weekly Technical Analysis
Oklo Inc
Advanced nuclear energy company developing small, fast-spectrum nuclear reactors designed to provide long-duration, carbon-free power for data centers, industrial users, and remote locations. Known for its focus on AI-driven energy demand and high-profile backers.
OKLO Technical Analysis Summary
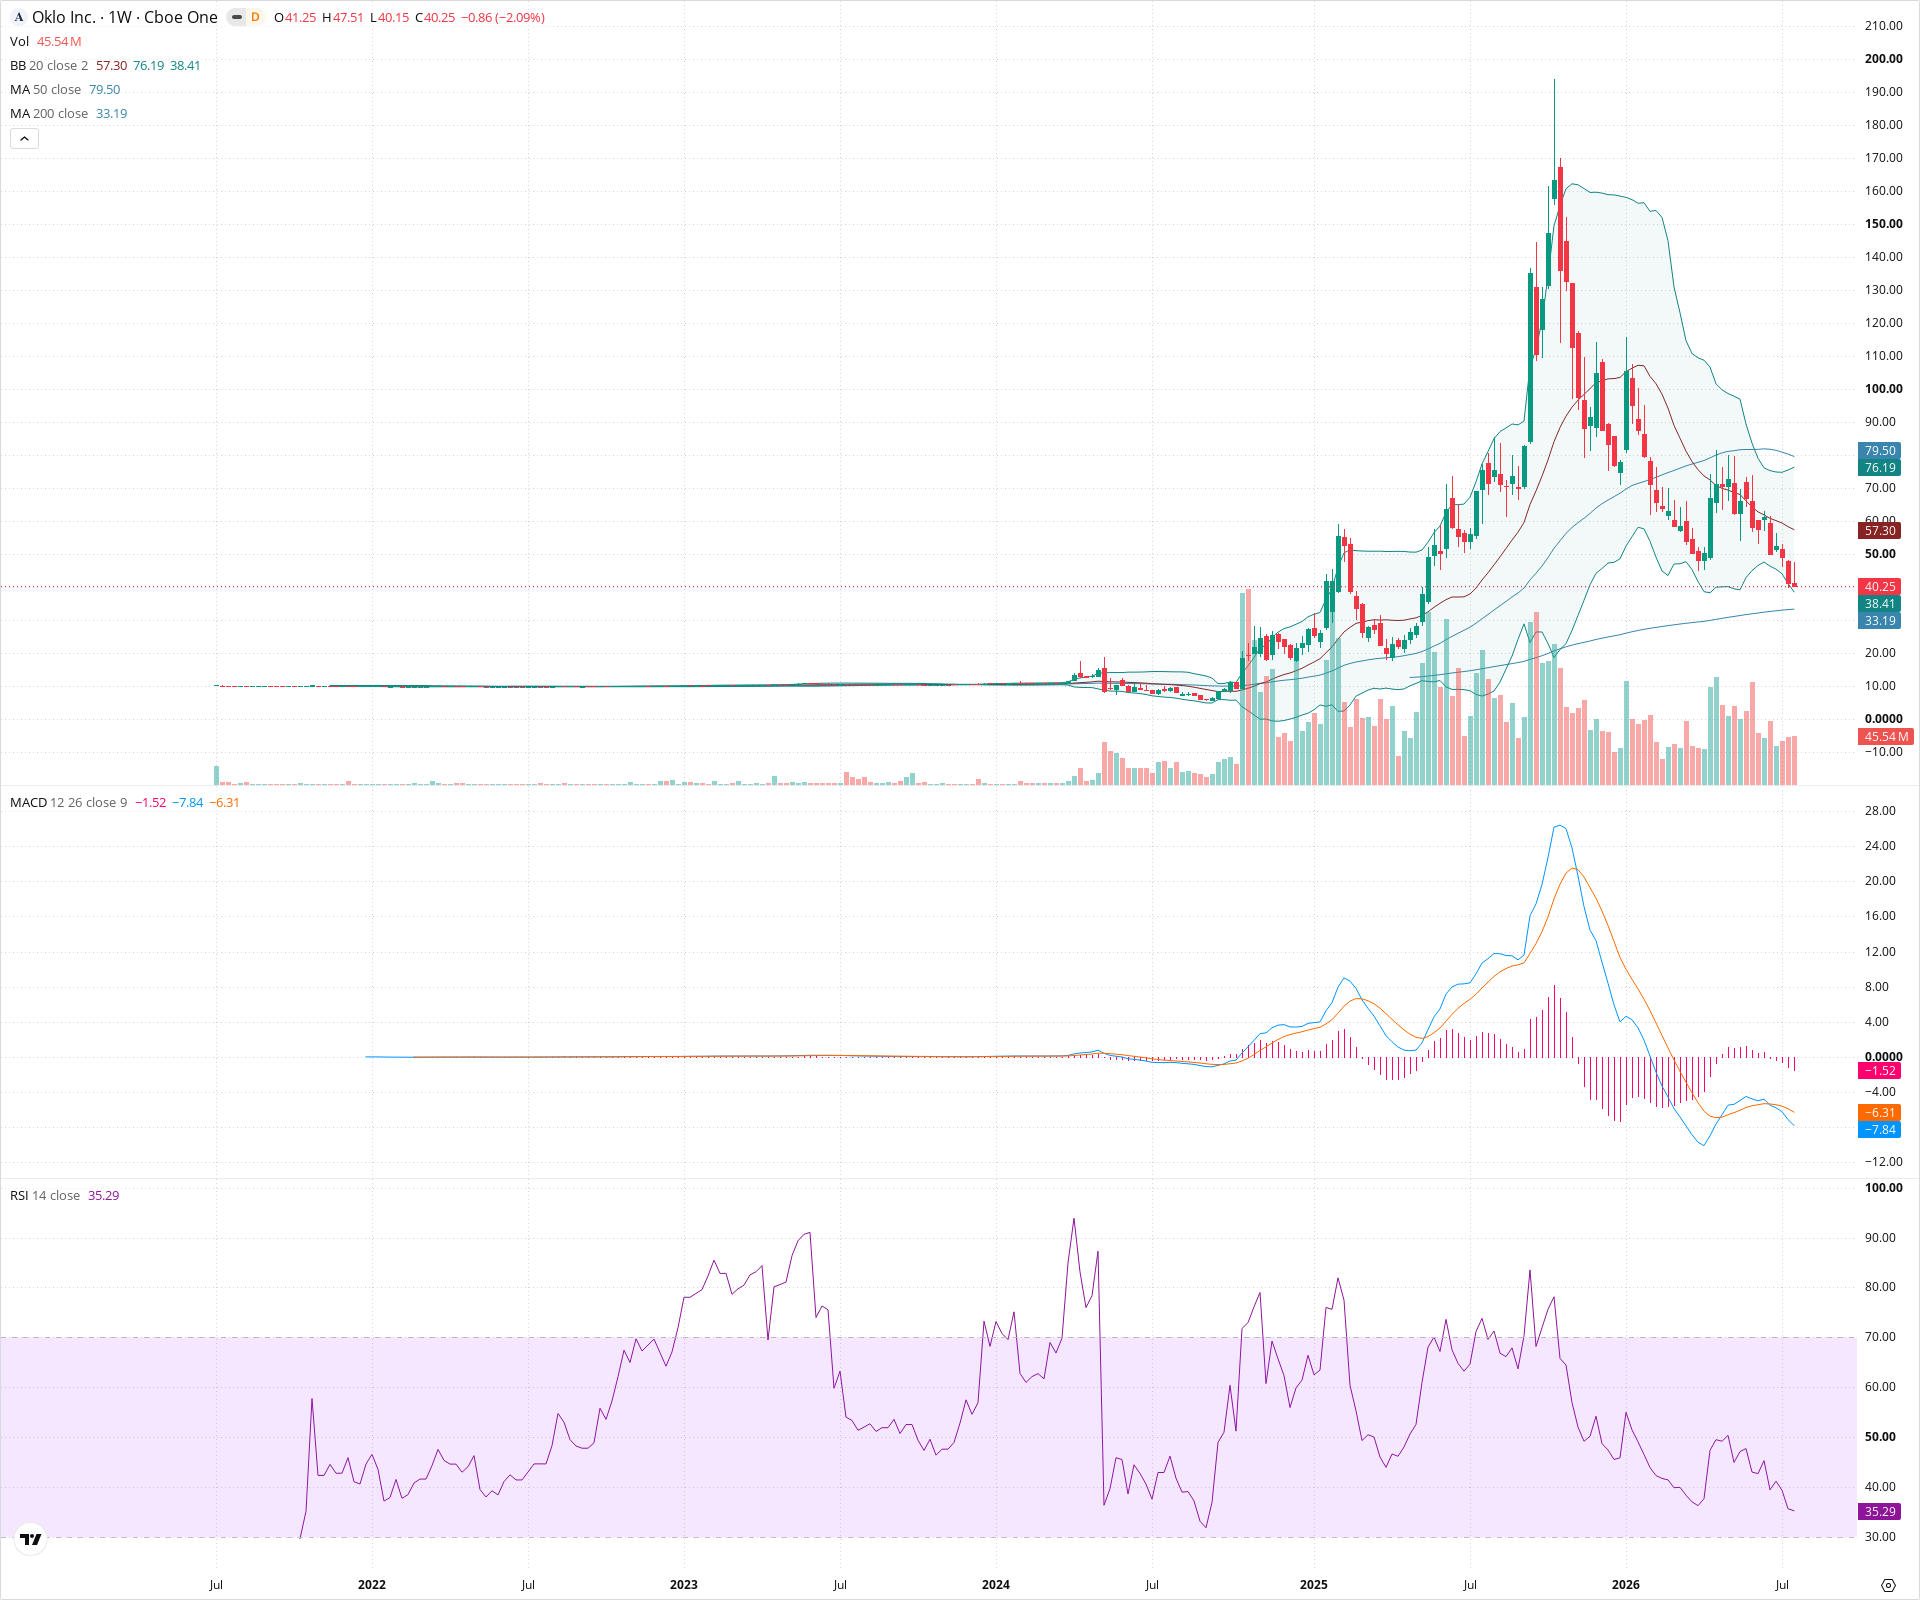
OKLO is in a severe, long-term structural downtrend following a massive blow-off top. The stock is currently characterized by strong bearish momentum, trading well below key short and medium-term moving averages. The primary focus for long-term investors is whether the price can find stabilizing support near the 200-week SMA in the $33 area, as further downside opens the door to much lower historical levels.
Included In Lists
Related Tickers of Interest
OKLO Weekly Chart
Sentiment
Short-term Sentiment (days to weeks): Bearish
Price is in a steep, ongoing downtrend, making new lower lows and trading below the 20-week SMA. The MACD histogram is negative and expanding downward, indicating strong bearish momentum.
Long-term Sentiment (weeks to months): Bearish
The stock has experienced a massive distribution phase following a blow-off top near $200. It is now trading well below a sharply declining 50-week SMA, confirming a structural long-term downtrend.
Report Metadata
- Timeframe: weekly
- Generated at: 2026-07-25T09:11:45.201Z
- Model: gemini-3.1-pro-preview
Support Price Levels
| Level | Range | Strength | Notes |
|---|---|---|---|
| $32.50 | $30.00 - $35.00 | Strong | Confluence of historical consolidation from the previous markup phase and the rising 200-week SMA near $33. |
| $12.50 | $10.00 - $15.00 | Strong | The multi-year, long-term base that preceded the massive historical run-up. |
Resistance Price Levels
| Level | Range | Strength | Notes |
|---|---|---|---|
| $57.50 | $55.00 - $60.00 | Strong | Recent consolidation floor that broke down, now acting as resistance. Also roughly aligns with the declining 20-week SMA. |
| $80.00 | $75.00 - $85.00 | Strong | A major previous structural breakdown level and the current location of the declining 50-week SMA. |
Potential Chart Patterns in Formation
| Strength | Pattern | Signal | Target | Details |
|---|---|---|---|---|
| Strong | Blow-Off Top and Distribution | Bearish | N/A | A massive, parabolic run-up followed by a sharp, sustained reversal and a long-term series of lower highs and lower lows. |
Frequently Asked Questions about OKLO
What is the current sentiment for OKLO?
The short-term sentiment for OKLO is currently Bearish because Price is in a steep, ongoing downtrend, making new lower lows and trading below the 20-week SMA. The MACD histogram is negative and expanding downward, indicating strong bearish momentum.. The long-term trend is classified as Bearish.
What are the key support levels for OKLO?
StockDips.AI has identified key support levels for OKLO at $32.50 and $12.50. These levels may represent potential accumulation zones where buying interest could emerge.
Is OKLO in a significant dip or a Value Dip right now?
OKLO has a Value Score of 84/100. It is currently flagged as a significant dip in the Top Dips list. It is not listed as a Value Dip because the long-term sentiment or value-score threshold does not qualify.
View the full interactive analysis on StockDips.AI.