PLTR Weekly Technical Analysis
Palantir Technologies Inc
Builds data analytics and AI software for governments and enterprises.
PLTR Technical Analysis Summary
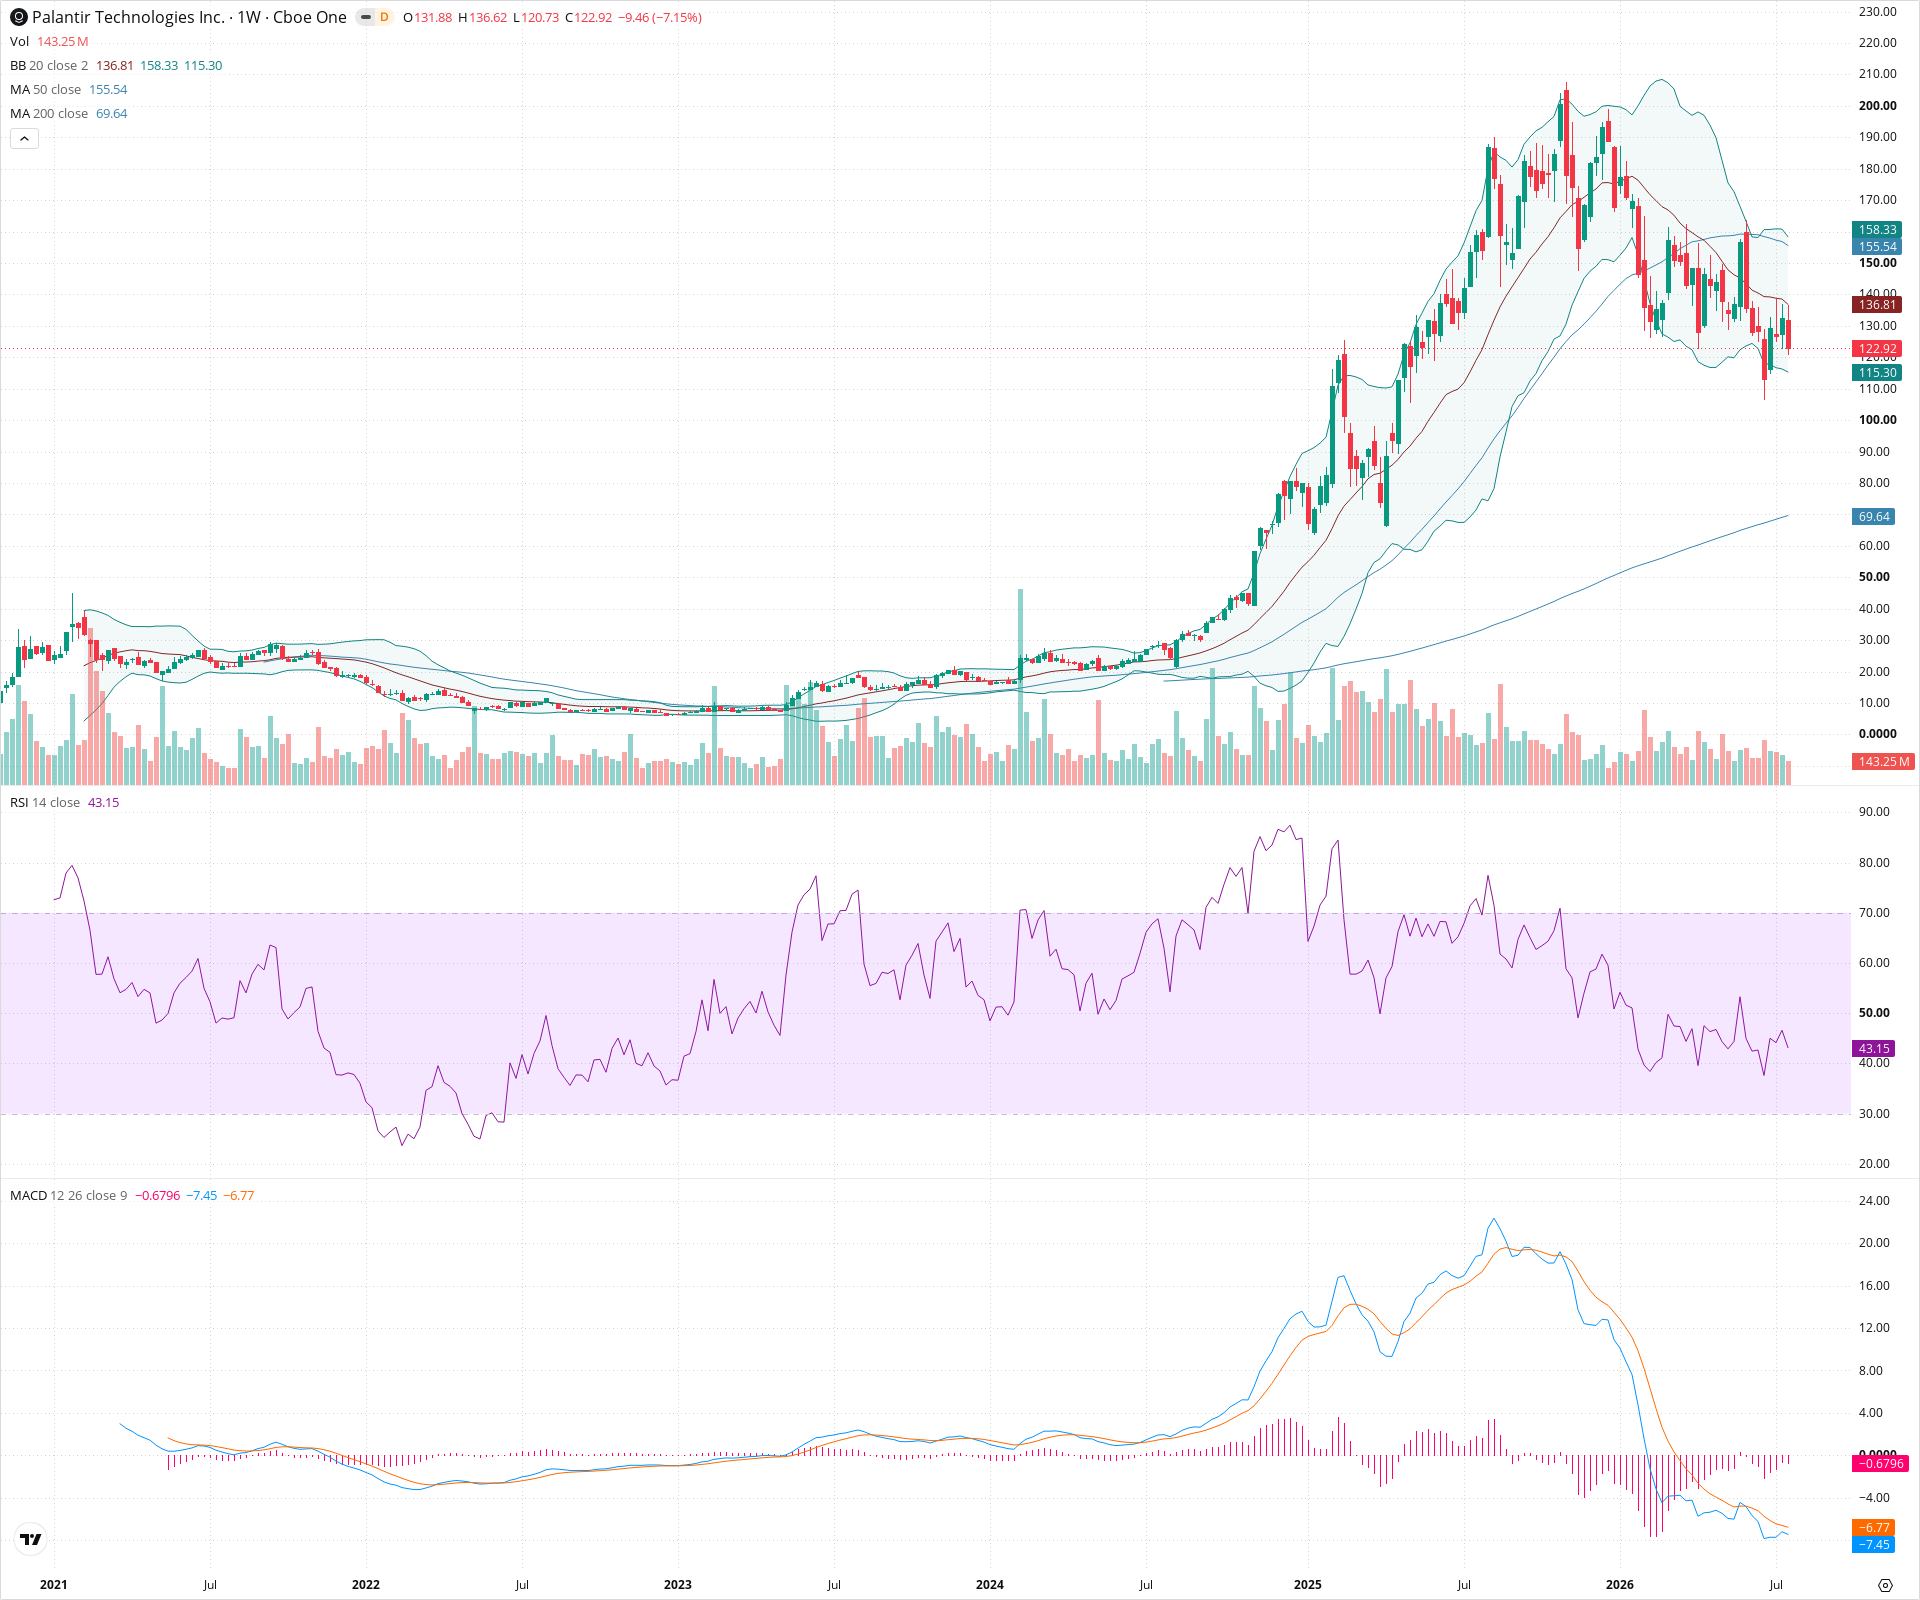
PLTR is currently experiencing a sharp, deep retracement on the weekly chart, having broken below its 50-week moving average. Short-term momentum is decisively bearish, with RSI below 50 and MACD deeply negative. However, the broader multi-year structure remains intact as long as the price holds above the 200-week SMA.
Included In Lists
Related Tickers of Interest
PLTR Weekly Chart
Sentiment
Short-term Sentiment (days to weeks): Bearish
Price is actively trading below the 50-week SMA and the lower Bollinger Band, with negative momentum indicated by a deeply negative MACD and RSI below 50.
Long-term Sentiment (weeks to months): Bullish
Despite the current sharp pullback, the long-term trend remains upward as the 50-week SMA is still above the 200-week SMA, and price is significantly above major structural support.
Report Metadata
- Timeframe: weekly
- Generated at: 2026-07-25T09:03:34.598Z
- Model: gemini-3.1-pro-preview
Support Price Levels
| Level | Range | Strength | Notes |
|---|---|---|---|
| $115.30 | $115.30 - $115.30 | Weak | Lower Bollinger Band level, acting as dynamic support. |
| $69.64 | $69.64 - $69.64 | Strong | 200-week SMA, which has historically provided significant long-term support. |
Resistance Price Levels
| Level | Range | Strength | Notes |
|---|---|---|---|
| $136.81 | $136.81 - $136.81 | Strong | 20-week SMA, often acting as near-term dynamic resistance during downtrends. |
| $155.54 | $155.54 - $155.54 | Strong | 50-week SMA, a key structural level that the price recently broke below. |
Potential Chart Patterns in Formation
| Strength | Pattern | Signal | Target | Details |
|---|---|---|---|---|
| Strong | Head and Shoulders Top (Potential) | Bearish | N/A | A complex topping structure appears to be forming after a prolonged uptrend, characterized by a series of lower highs following the peak near 200. |
Frequently Asked Questions about PLTR
What is the current sentiment for PLTR?
The short-term sentiment for PLTR is currently Bearish because Price is actively trading below the 50-week SMA and the lower Bollinger Band, with negative momentum indicated by a deeply negative MACD and RSI below 50.. The long-term trend is classified as Bullish.
What are the key support levels for PLTR?
StockDips.AI has identified key support levels for PLTR at $115.30 and $69.64. These levels may represent potential accumulation zones where buying interest could emerge.
Is PLTR in a significant dip or a Value Dip right now?
PLTR has a Value Score of 37/100. It is not currently flagged as a significant dip in the Top Dips list. It is not listed as a Value Dip because the long-term sentiment or value-score threshold does not qualify.
View the full interactive analysis on StockDips.AI.