SMR Weekly Technical Analysis
NuScale Power Corporation
Develops small modular nuclear reactors (SMRs) aimed at scalable, low-carbon nuclear power generation.
SMR Technical Analysis Summary
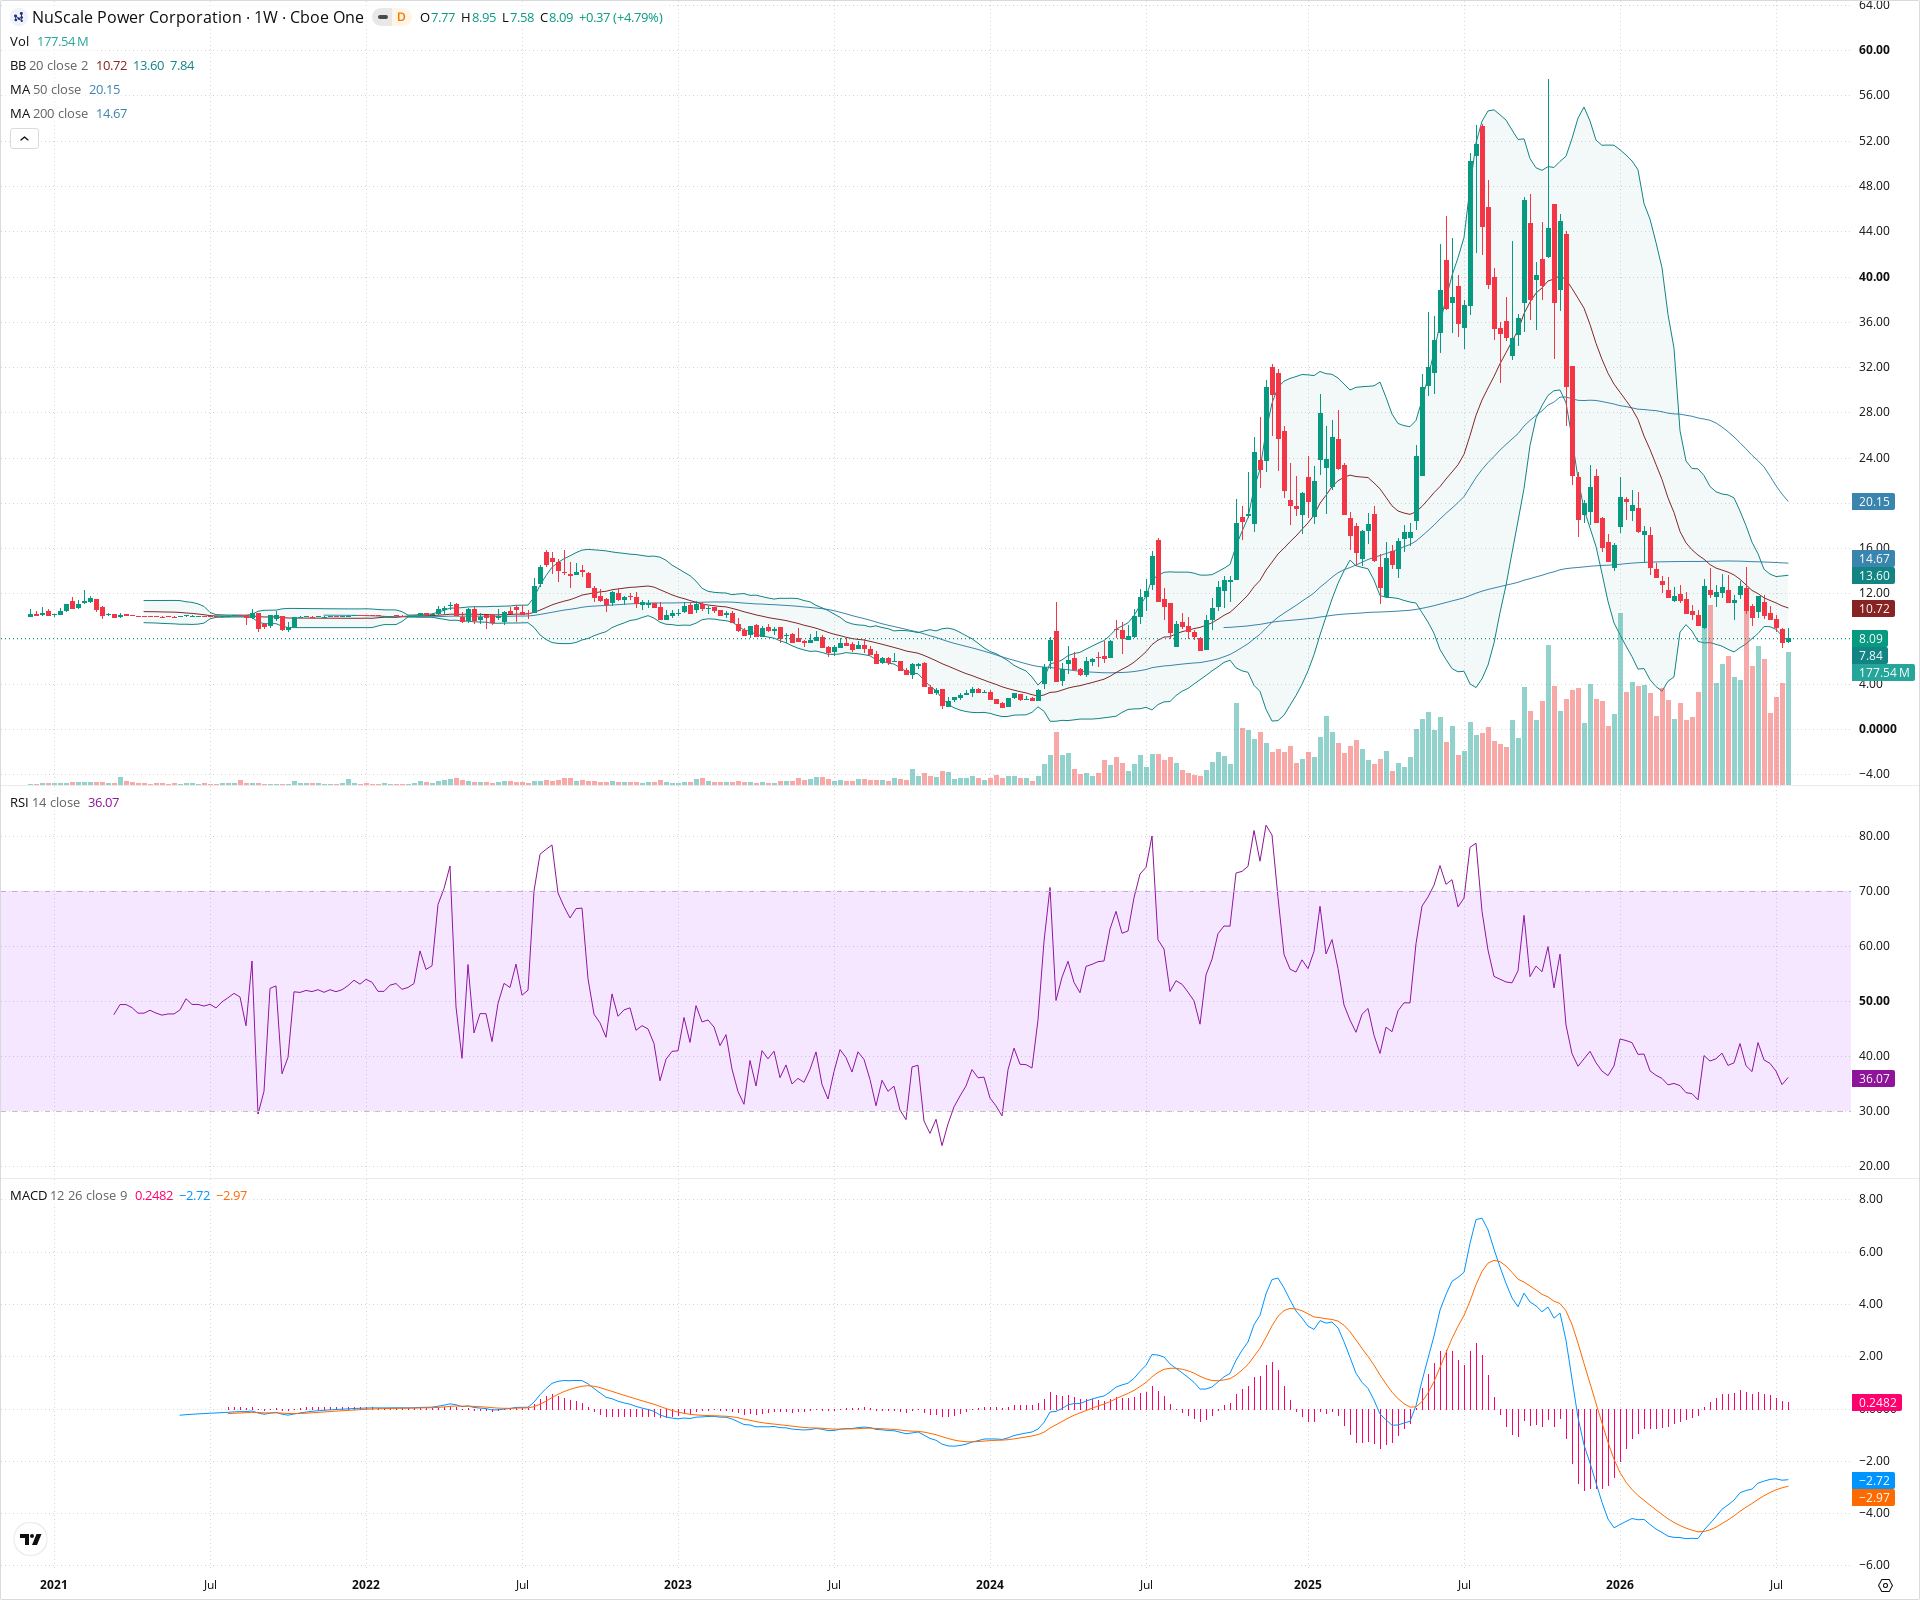
The weekly chart illustrates a massive, sustained downtrend from previous highs above $50 down to the current $8 level. The price is trading below all key weekly moving averages (20, 50, 200), reflecting dominance by sellers across multiple timeframes. While the MACD histogram shows some positive divergence indicating slowing downside momentum, the primary trend remains decisively bearish until price can reclaim the 20-week SMA.
Included In Lists
Related Tickers of Interest
SMR Weekly Chart
Sentiment
Short-term Sentiment (days to weeks): Bearish
Price remains firmly below the 20-week SMA in a strong downtrend, although a slight uptick in the MACD histogram and RSI suggests short-term downside momentum may be slowing.
Long-term Sentiment (weeks to months): Bearish
The stock is in a severe long-term downtrend, trading well below the 50-week and 200-week SMAs, with the 50-week SMA sloping downwards.
Report Metadata
- Timeframe: weekly
- Generated at: 2026-07-25T09:11:27.925Z
- Model: gemini-3.1-pro-preview
Support Price Levels
| Level | Range | Strength | Notes |
|---|---|---|---|
| $7.80 | $7.50 - $8.10 | Weak | Current local lows attempting to form a base. |
| $4.50 | $4.00 - $5.00 | Strong | Major structural lows established much earlier in the chart's history. |
Resistance Price Levels
| Level | Range | Strength | Notes |
|---|---|---|---|
| $11.00 | $10.50 - $11.50 | Strong | Dynamic resistance at the declining 20-week SMA and recent swing highs. |
| $14.50 | $14.00 - $15.00 | Strong | Confluence of the 200-week SMA and previous structural support turned resistance. |
| $20.00 | $19.00 - $21.00 | Strong | Major breakdown zone and current position of the 50-week SMA. |
Potential Chart Patterns in Formation
| Strength | Pattern | Signal | Target | Details |
|---|---|---|---|---|
| Strong | Prolonged Downtrend | Bearish | N/A | A sustained series of lower highs and lower lows stretching back several months, punctuated by minor corrective bounces that fail at the 20-week SMA. |
Frequently Asked Questions about SMR
What is the current sentiment for SMR?
The short-term sentiment for SMR is currently Bearish because Price remains firmly below the 20-week SMA in a strong downtrend, although a slight uptick in the MACD histogram and RSI suggests short-term downside momentum may be slowing.. The long-term trend is classified as Bearish.
What are the key support levels for SMR?
StockDips.AI has identified key support levels for SMR at $7.80 and $4.50. These levels may represent potential accumulation zones where buying interest could emerge.
Is SMR in a significant dip or a Value Dip right now?
SMR has a Value Score of 74/100. It is currently flagged as a significant dip in the Top Dips list. It is not listed as a Value Dip because the long-term sentiment or value-score threshold does not qualify.
View the full interactive analysis on StockDips.AI.