XOM Weekly Technical Analysis
Exxon Mobil Corp.
Multinational oil and gas company engaged in exploration, refining, and chemicals.
XOM Technical Analysis Summary
XOM remains in a strong long-term uptrend characterized by rising major moving averages. The recent significant pullback found robust support at the 50-week SMA, leading to a vigorous bounce. Technical indicators like RSI and an improving MACD histogram support a bullish short-to-medium term outlook, suggesting a potential retest of prior highs.
Included In Lists
Related Tickers of Interest
XOM Weekly Chart
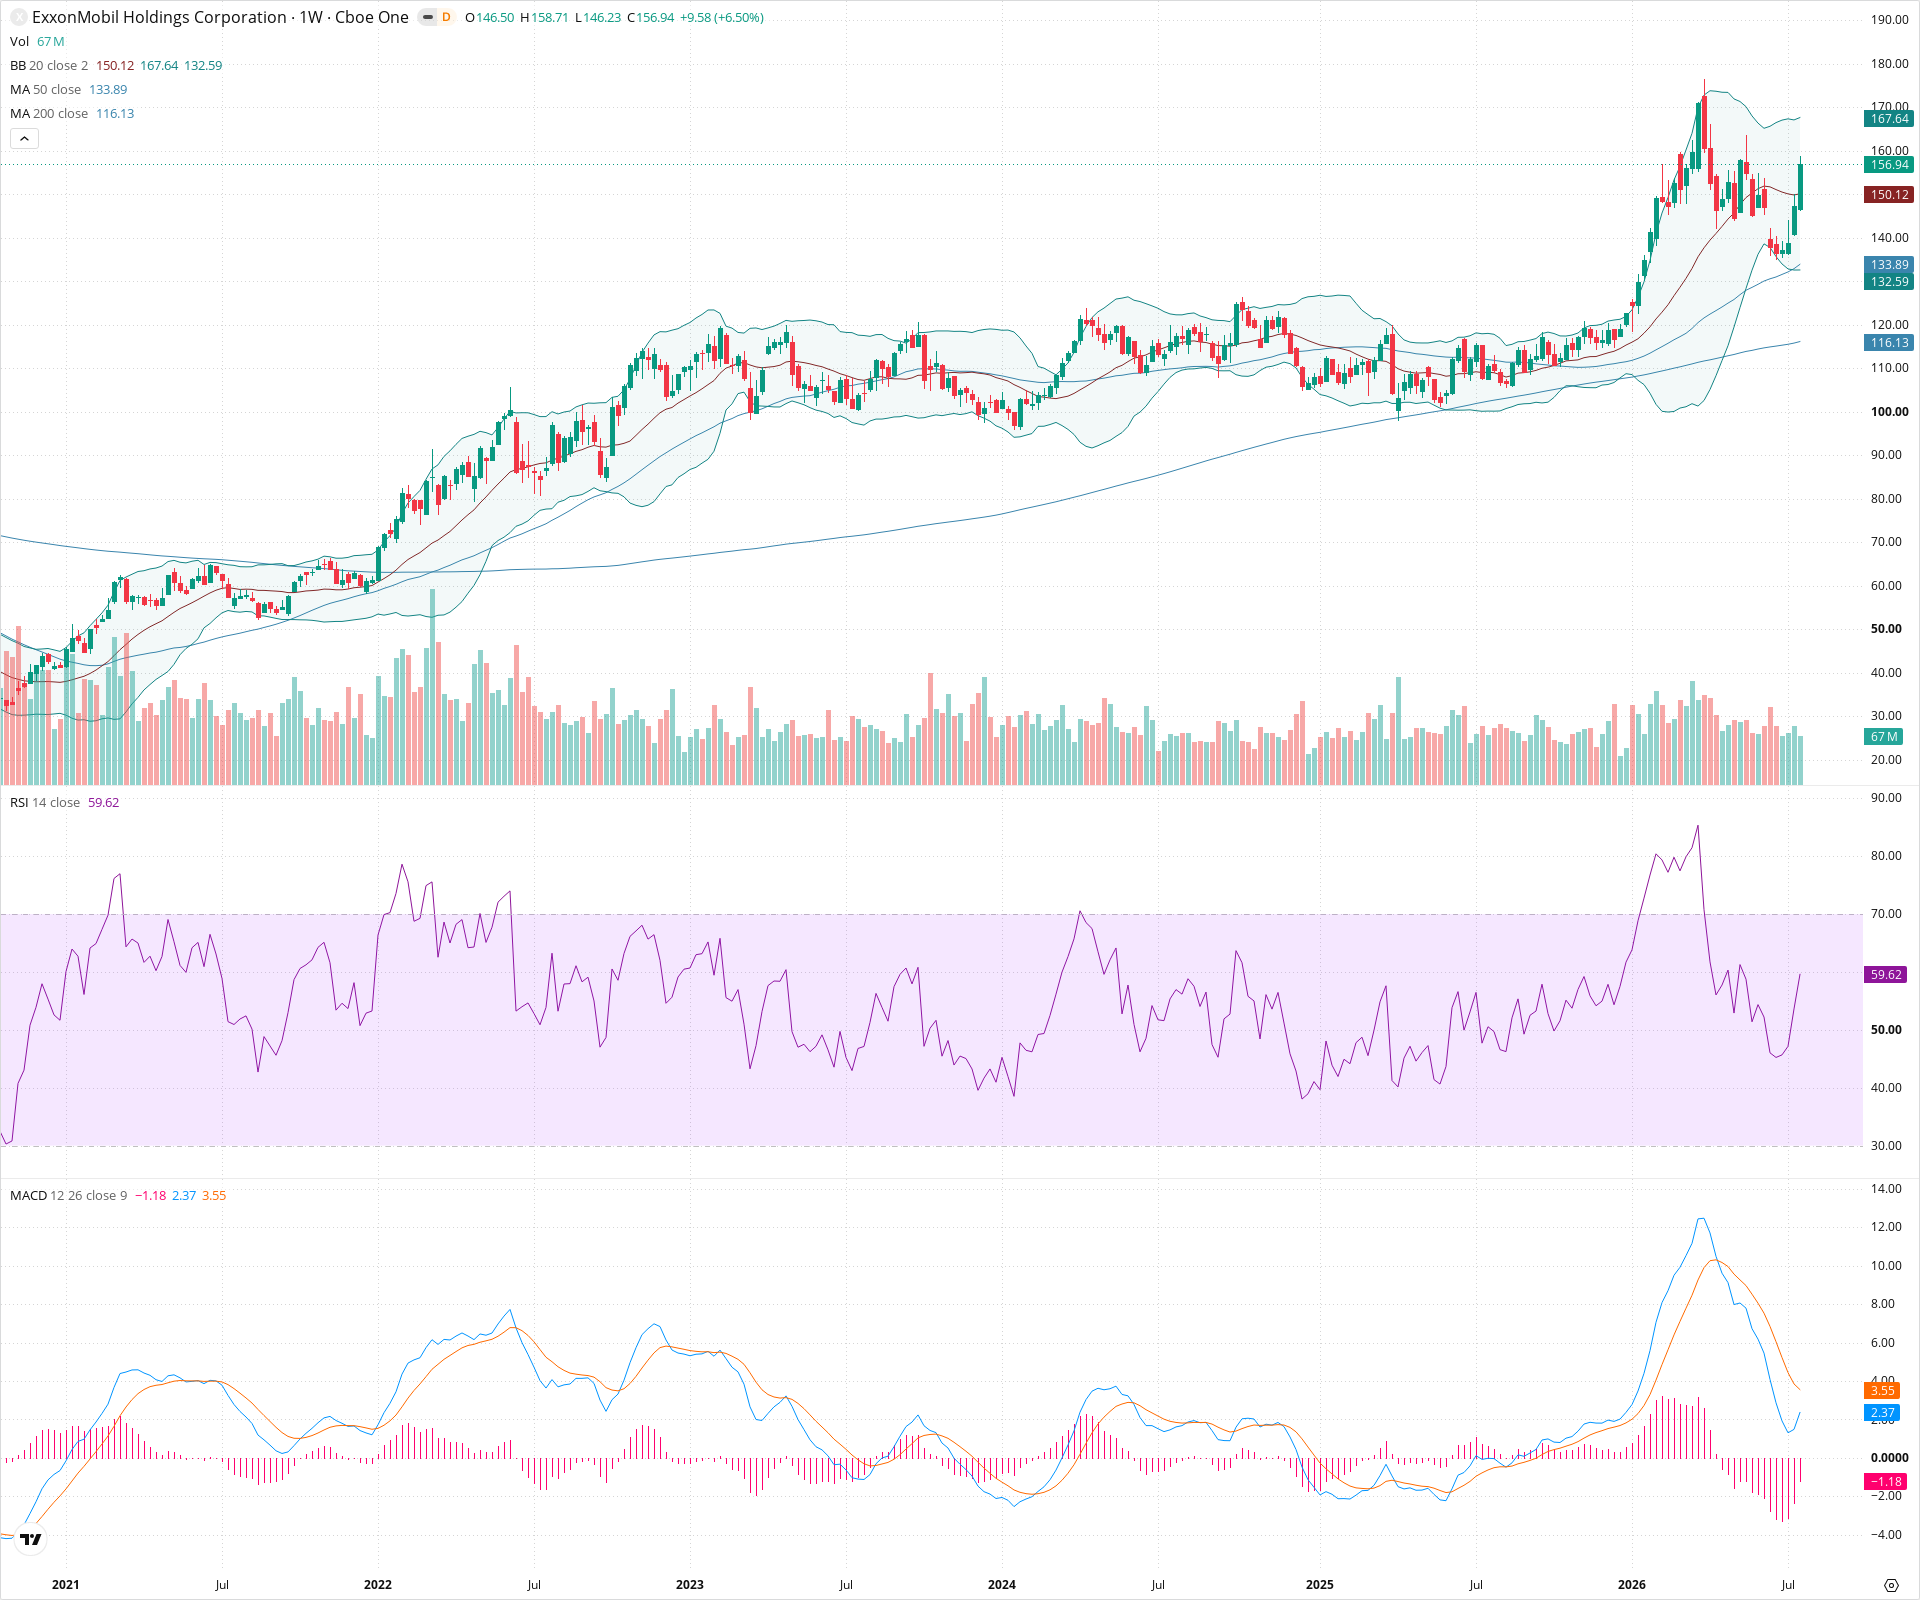
Sentiment
Short-term Sentiment (days to weeks): Bullish
Price has strongly bounced off the 50-week SMA, breaking back above recent consolidation levels. RSI is rising above 50, and the MACD histogram is narrowing, indicating waning bearish momentum and a shift toward the upside.
Long-term Sentiment (weeks to months): Bullish
The long-term trend is clearly up, with price maintaining a sequence of higher highs and higher lows. Both the 50-week and 200-week SMAs are trending upward, with price currently well above both.
Report Metadata
- Timeframe: weekly
- Generated at: 2026-07-25T09:03:28.299Z
- Model: gemini-3.1-pro-preview
Support Price Levels
| Level | Range | Strength | Notes |
|---|---|---|---|
| $142.50 | $140.00 - $145.00 | Weak | Minor support area from recent price action and minor swing lows before the current bounce. |
| $132.50 | $130.00 - $135.00 | Strong | Major confluence zone including the rising 50-week SMA and the recent significant swing low. |
| $117.50 | $115.00 - $120.00 | Strong | Long-term structural support zone aligned with the rising 200-week SMA and prior multi-month consolidation. |
Resistance Price Levels
| Level | Range | Strength | Notes |
|---|---|---|---|
| $167.50 | $165.00 - $170.00 | Weak | Intermediate resistance zone nearing the upper Bollinger Band and recent minor structural peaks. |
| $180.00 | $175.00 - $185.00 | Strong | Major resistance at the all-time high zone. |
Potential Chart Patterns in Formation
| Strength | Pattern | Signal | Target | Details |
|---|---|---|---|---|
| Strong | Pullback and Bounce | Bullish | $180.00 | Price experienced a healthy multi-week pullback to the 50-week SMA and has subsequently bounced strongly, resuming the primary uptrend. |
Frequently Asked Questions about XOM
What is the current sentiment for XOM?
The short-term sentiment for XOM is currently Bullish because Price has strongly bounced off the 50-week SMA, breaking back above recent consolidation levels. RSI is rising above 50, and the MACD histogram is narrowing, indicating waning bearish momentum and a shift toward the upside.. The long-term trend is classified as Bullish.
What are the key support levels for XOM?
StockDips.AI has identified key support levels for XOM at $142.50 and $132.50. These levels may represent potential accumulation zones where buying interest could emerge.
Is XOM in a significant dip or a Value Dip right now?
XOM has a Value Score of 30/100. It is not currently flagged as a significant dip in the Top Dips list. It is not listed as a Value Dip because the long-term sentiment or value-score threshold does not qualify.
View the full interactive analysis on StockDips.AI.