MSFT Daily Technical Analysis
Microsoft Corporation
Develops software, cloud computing, and AI tools including Windows, Office, and Azure.
MSFT Technical Analysis Summary
The technical outlook for MSFT on the daily timeframe remains predominantly bearish over the long term. The stock is entrenched in a defined downtrend, trading beneath declining 50-day and 200-day moving averages. While recent bullish momentum signals from the MACD and RSI suggest the possibility of a short-term relief bounce, the stock must overcome significant overhead resistance, starting at the 20-day SMA, to indicate any meaningful shift in the broader downward trajectory.
Included In Lists
Related Tickers of Interest
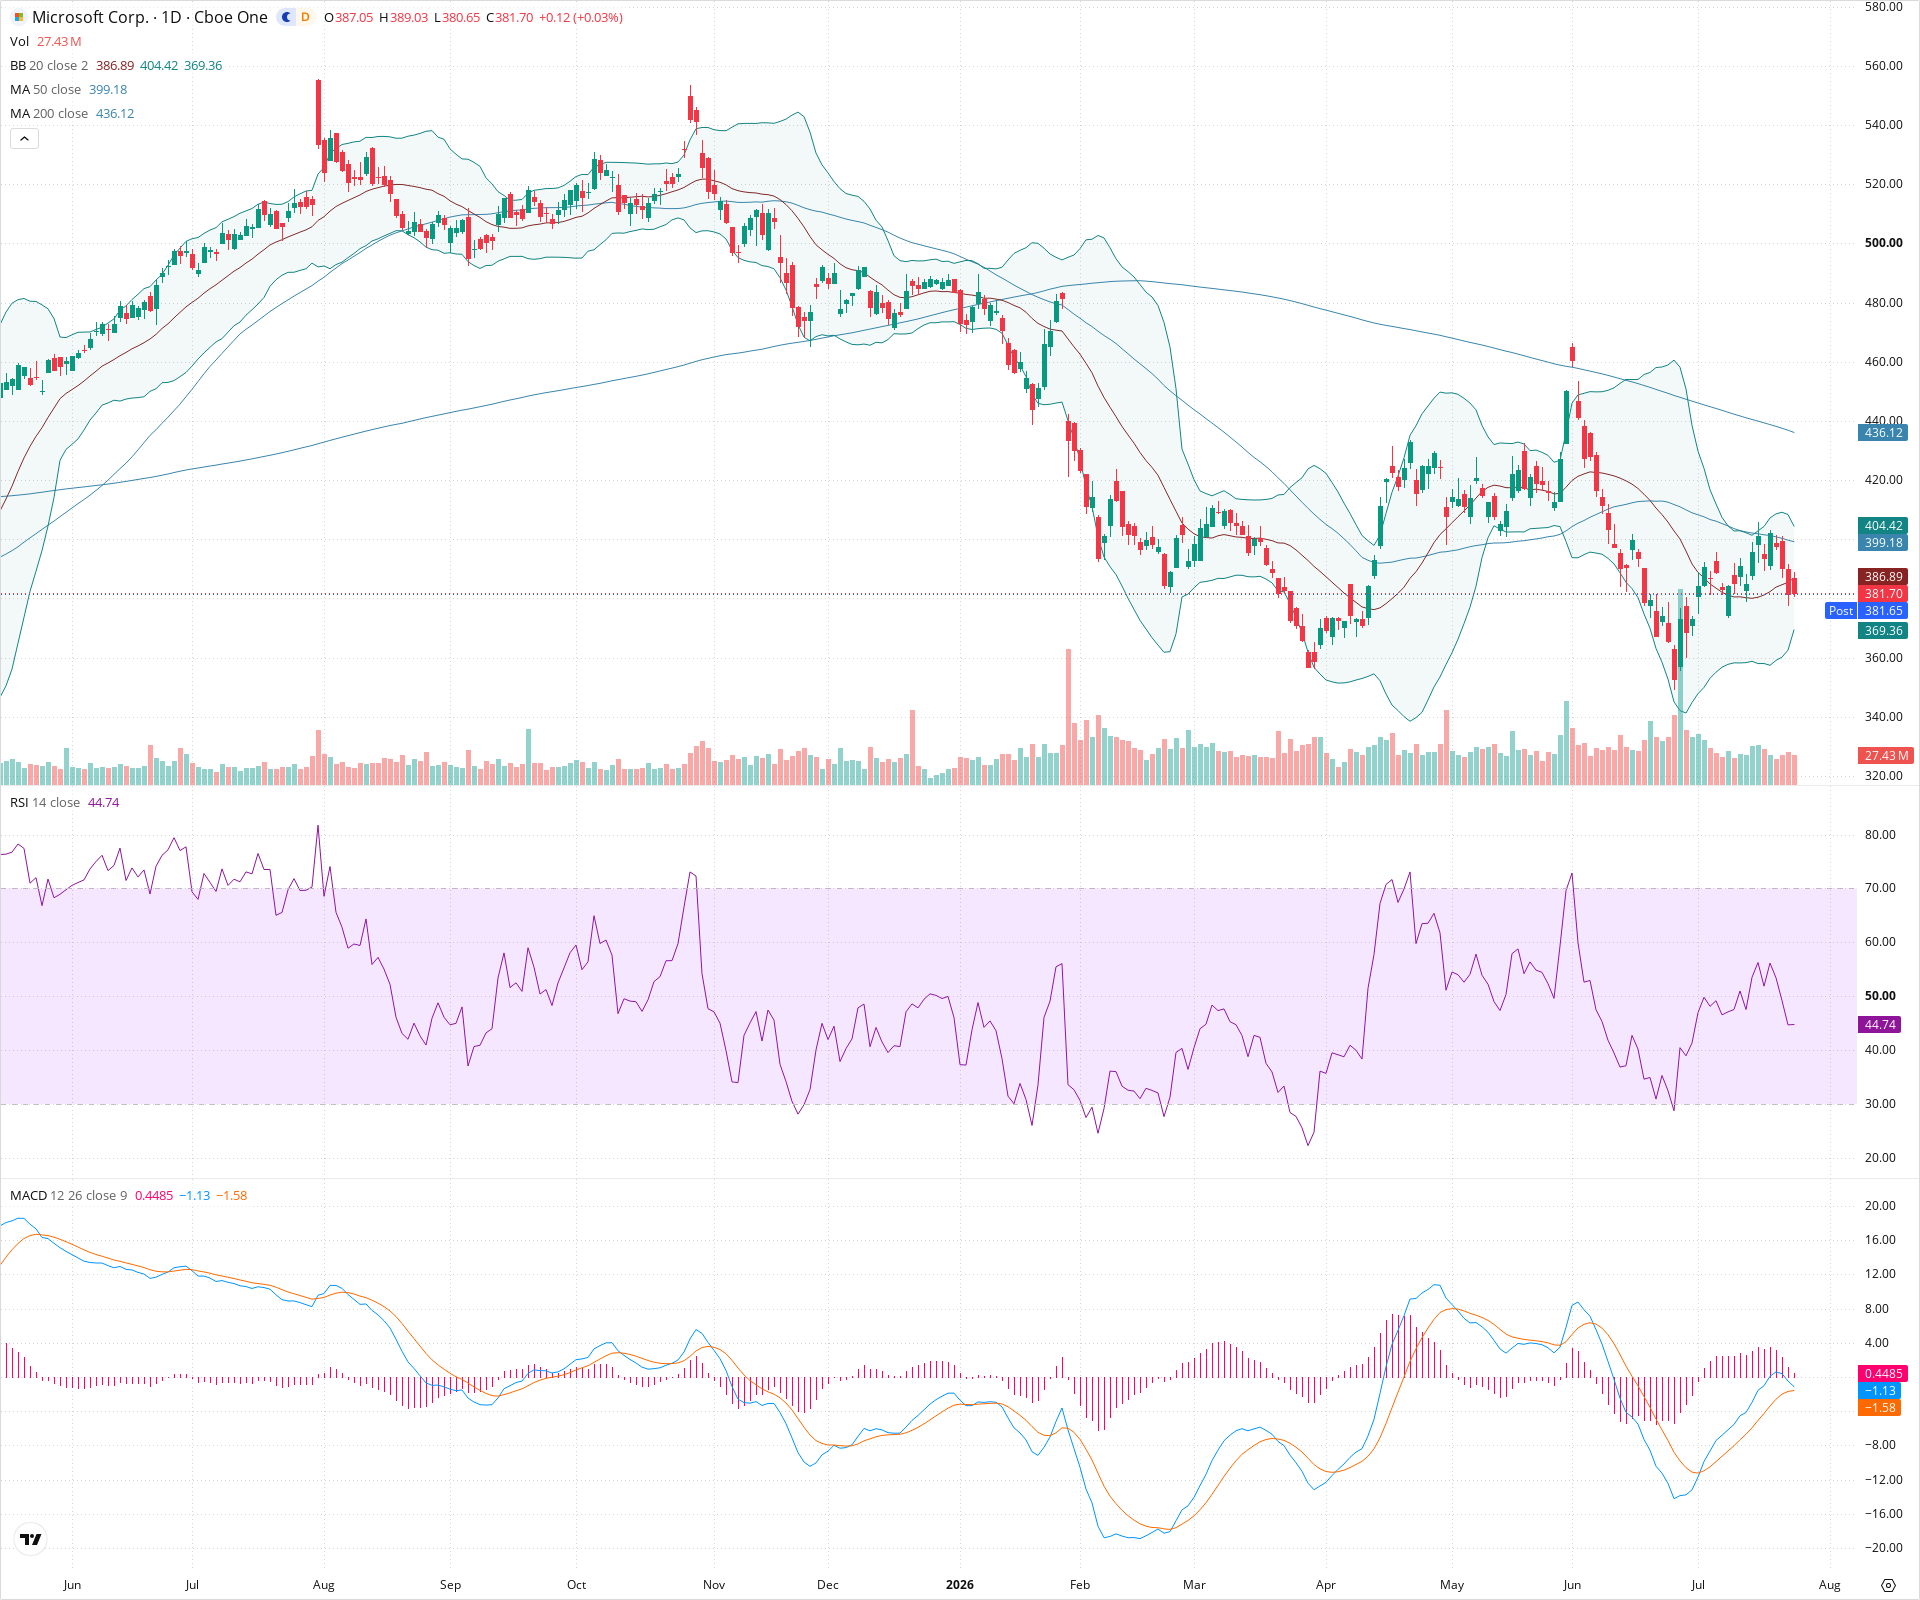
MSFT Daily Chart
Sentiment
Short-term Sentiment (days to weeks): Neutral
The short-term trend remains downward as price struggles below the 20-day SMA. However, short-term momentum is shifting positively, evidenced by a recent bullish MACD crossover, expanding positive histogram, and an upwardly sloping RSI recovering from lower levels. This conflicting picture suggests a potential period of consolidation or a minor relief rally within the broader downtrend.
Long-term Sentiment (weeks to months): Bearish
The long-term technical structure is decidedly bearish. The price is trading well below both the 50-day and 200-day simple moving averages. Additionally, the 50-day SMA has crossed below the 200-day SMA, and both are sloping downward, confirming a sustained long-term downtrend characterized by a series of lower highs and lower lows.
Report Metadata
- Timeframe: daily
- Generated at: 2026-07-24T21:02:35.398Z
- Model: gemini-3.1-pro-preview
Support Price Levels
| Level | Range | Strength | Notes |
|---|---|---|---|
| $377.50 | $375.00 - $380.00 | Weak | Immediate, minor support area based on recent daily candle lows during the current choppy consolidation phase. |
| $362.50 | $360.00 - $365.00 | Strong | Recent swing low from late June/early July where significant buying pressure emerged to halt the steep sell-off. |
Resistance Price Levels
| Level | Range | Strength | Notes |
|---|---|---|---|
| $389.00 | $386.00 - $392.00 | Moderate | Immediate overhead resistance zone defined by the declining 20-day SMA and recent minor swing highs. |
| $400.00 | $395.00 - $405.00 | Strong | A critical resistance area encompassing the declining 50-day SMA and a previous consolidation zone that broke down in mid-June. |
| $440.00 | $435.00 - $445.00 | Strong | Major structural resistance zone aligning with the 200-day SMA and significant previous price peaks. |
Potential Chart Patterns in Formation
| Strength | Pattern | Signal | Target | Details |
|---|---|---|---|---|
| Strong | Downtrend / Descending Channel | Bearish | N/A | A prolonged pattern of lower highs and lower lows visible across the majority of the chart, indicating sustained seller control. |
| Weak | Counter-trend Rally (Attempted) | Bullish | $399.00 | Price recently bounced off the lower Bollinger Band, accompanied by a bullish MACD crossover and rising RSI, suggesting an attempt at a short-term bounce against the primary downtrend. |
Frequently Asked Questions about MSFT
What is the current sentiment for MSFT?
The short-term sentiment for MSFT is currently Neutral because The short-term trend remains downward as price struggles below the 20-day SMA. However, short-term momentum is shifting positively, evidenced by a recent bullish MACD crossover, expanding positive histogram, and an upwardly sloping RSI recovering from lower levels. This conflicting picture suggests a potential period of consolidation or a minor relief rally within the broader downtrend.. The long-term trend is classified as Bearish.
What are the key support levels for MSFT?
StockDips.AI has identified key support levels for MSFT at $377.50 and $362.50. These levels may represent potential accumulation zones where buying interest could emerge.
Is MSFT in a significant dip or a Value Dip right now?
MSFT has a Value Score of 63/100. It is not currently flagged as a significant dip in the Top Dips list. It is not listed as a Value Dip because the long-term sentiment or value-score threshold does not qualify.
View the full interactive analysis on StockDips.AI.