GOOGL Daily Technical Analysis
Alphabet Inc
Parent of Google leading in search, advertising, YouTube, and cloud computing.
GOOGL Technical Analysis Summary
GOOGL has experienced a significant correction from its recent highs, breaking key short-term support levels and completing a bearish topping pattern. The stock is currently testing critical long-term support at the 200-day SMA. A failure to hold this level could lead to further downside, while a sustained bounce is necessary to stabilize the broader long-term trend.
Included In Lists
Related Tickers of Interest
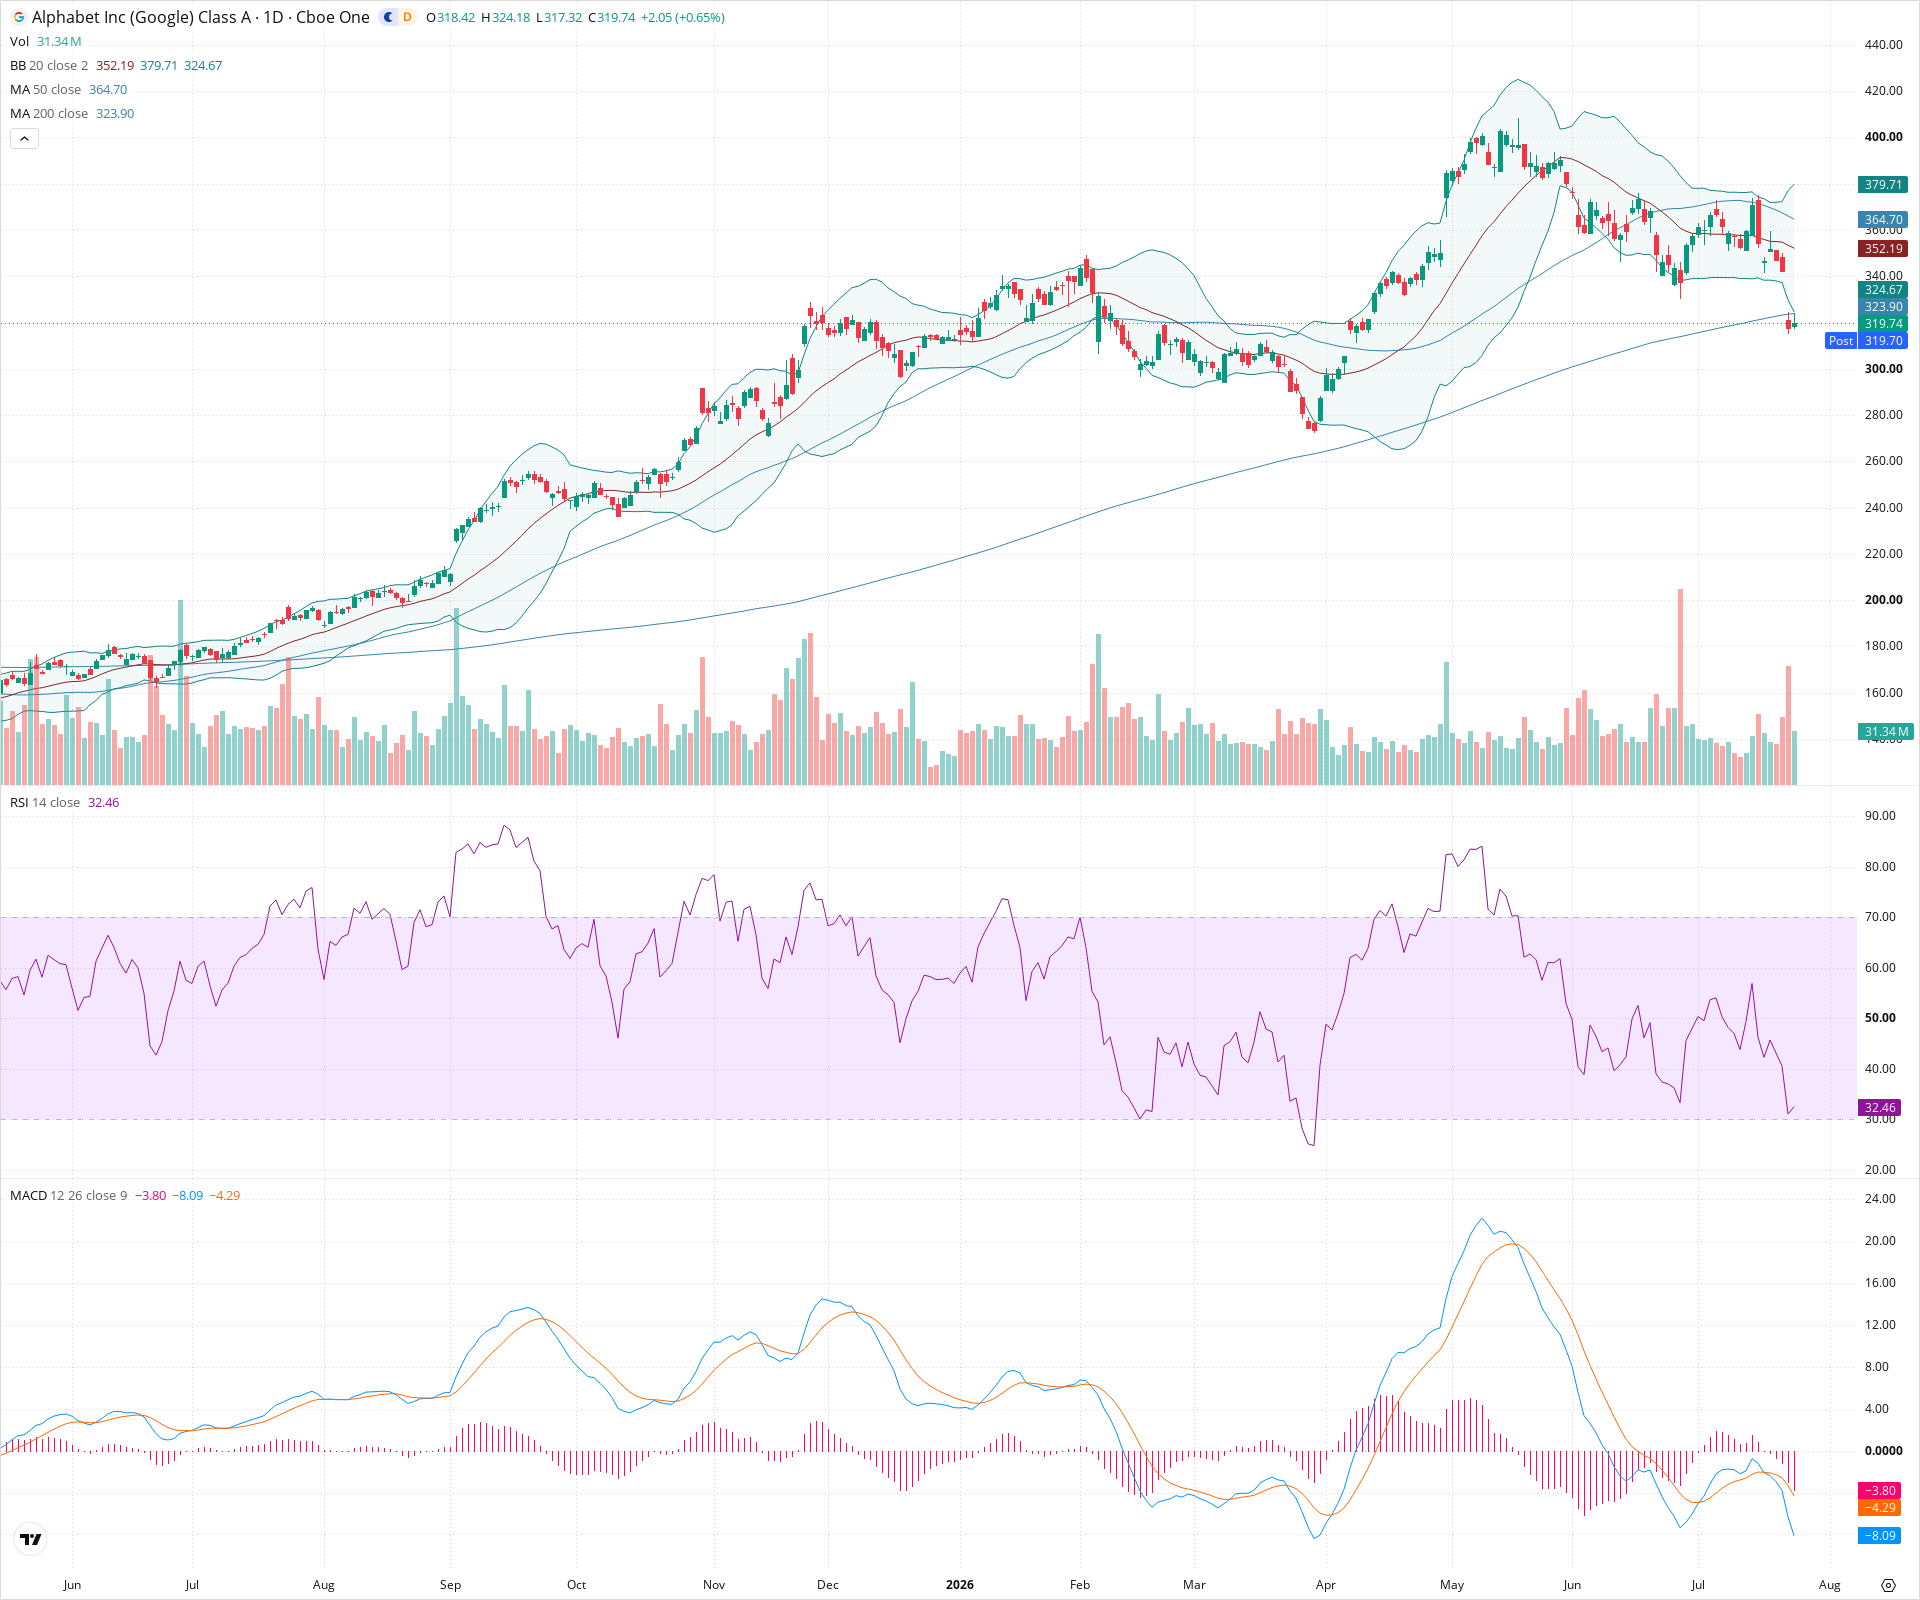
GOOGL Daily Chart
Sentiment
Short-term Sentiment (days to weeks): Bearish
Price is in a sharp downtrend, trading below the 20-day and 50-day SMAs. MACD is negative with an expanding bearish histogram, and RSI is hovering near oversold levels.
Long-term Sentiment (weeks to months): Neutral
While the overarching trend has been upward, the recent sharp correction has brought price down to test the critical 200-day SMA. The 50-day SMA is beginning to flatten and slope downward, suggesting a potential trend shift if support fails.
Report Metadata
- Timeframe: daily
- Generated at: 2026-07-24T21:02:21.598Z
- Model: gemini-3.1-pro-preview
Support Price Levels
| Level | Range | Strength | Notes |
|---|---|---|---|
| $320.00 | $315.00 - $325.00 | Strong | Current test area including the recent swing low and the 200-day SMA. |
| $272.50 | $265.00 - $280.00 | Strong | Previous major consolidation zone and swing low from earlier in the uptrend. |
Resistance Price Levels
| Level | Range | Strength | Notes |
|---|---|---|---|
| $350.00 | $345.00 - $355.00 | Strong | Previous support level that was broken, now expected to act as resistance, aligning with the neckline of a topping pattern. |
| $367.50 | $360.00 - $375.00 | Strong | Resistance zone containing the declining 20-day and 50-day SMAs. |
Potential Chart Patterns in Formation
| Strength | Pattern | Signal | Target | Details |
|---|---|---|---|---|
| Strong | Head and Shoulders Top | Bearish | $280.00 | A topping pattern is visible with a peak near 420 and a neckline around 350, which price has recently broken below. |
Frequently Asked Questions about GOOGL
What is the current sentiment for GOOGL?
The short-term sentiment for GOOGL is currently Bearish because Price is in a sharp downtrend, trading below the 20-day and 50-day SMAs. MACD is negative with an expanding bearish histogram, and RSI is hovering near oversold levels.. The long-term trend is classified as Neutral.
What are the key support levels for GOOGL?
StockDips.AI has identified key support levels for GOOGL at $320.00 and $272.50. These levels may represent potential accumulation zones where buying interest could emerge.
Is GOOGL in a significant dip or a Value Dip right now?
GOOGL has a Value Score of 101/100. It is not currently flagged as a significant dip in the Top Dips list. It is not listed as a Value Dip because the long-term sentiment or value-score threshold does not qualify.
View the full interactive analysis on StockDips.AI.