ASML Daily Technical Analysis
ASML Holding
Manufactures advanced lithography machines essential for semiconductor manufacturing.
ASML Technical Analysis Summary
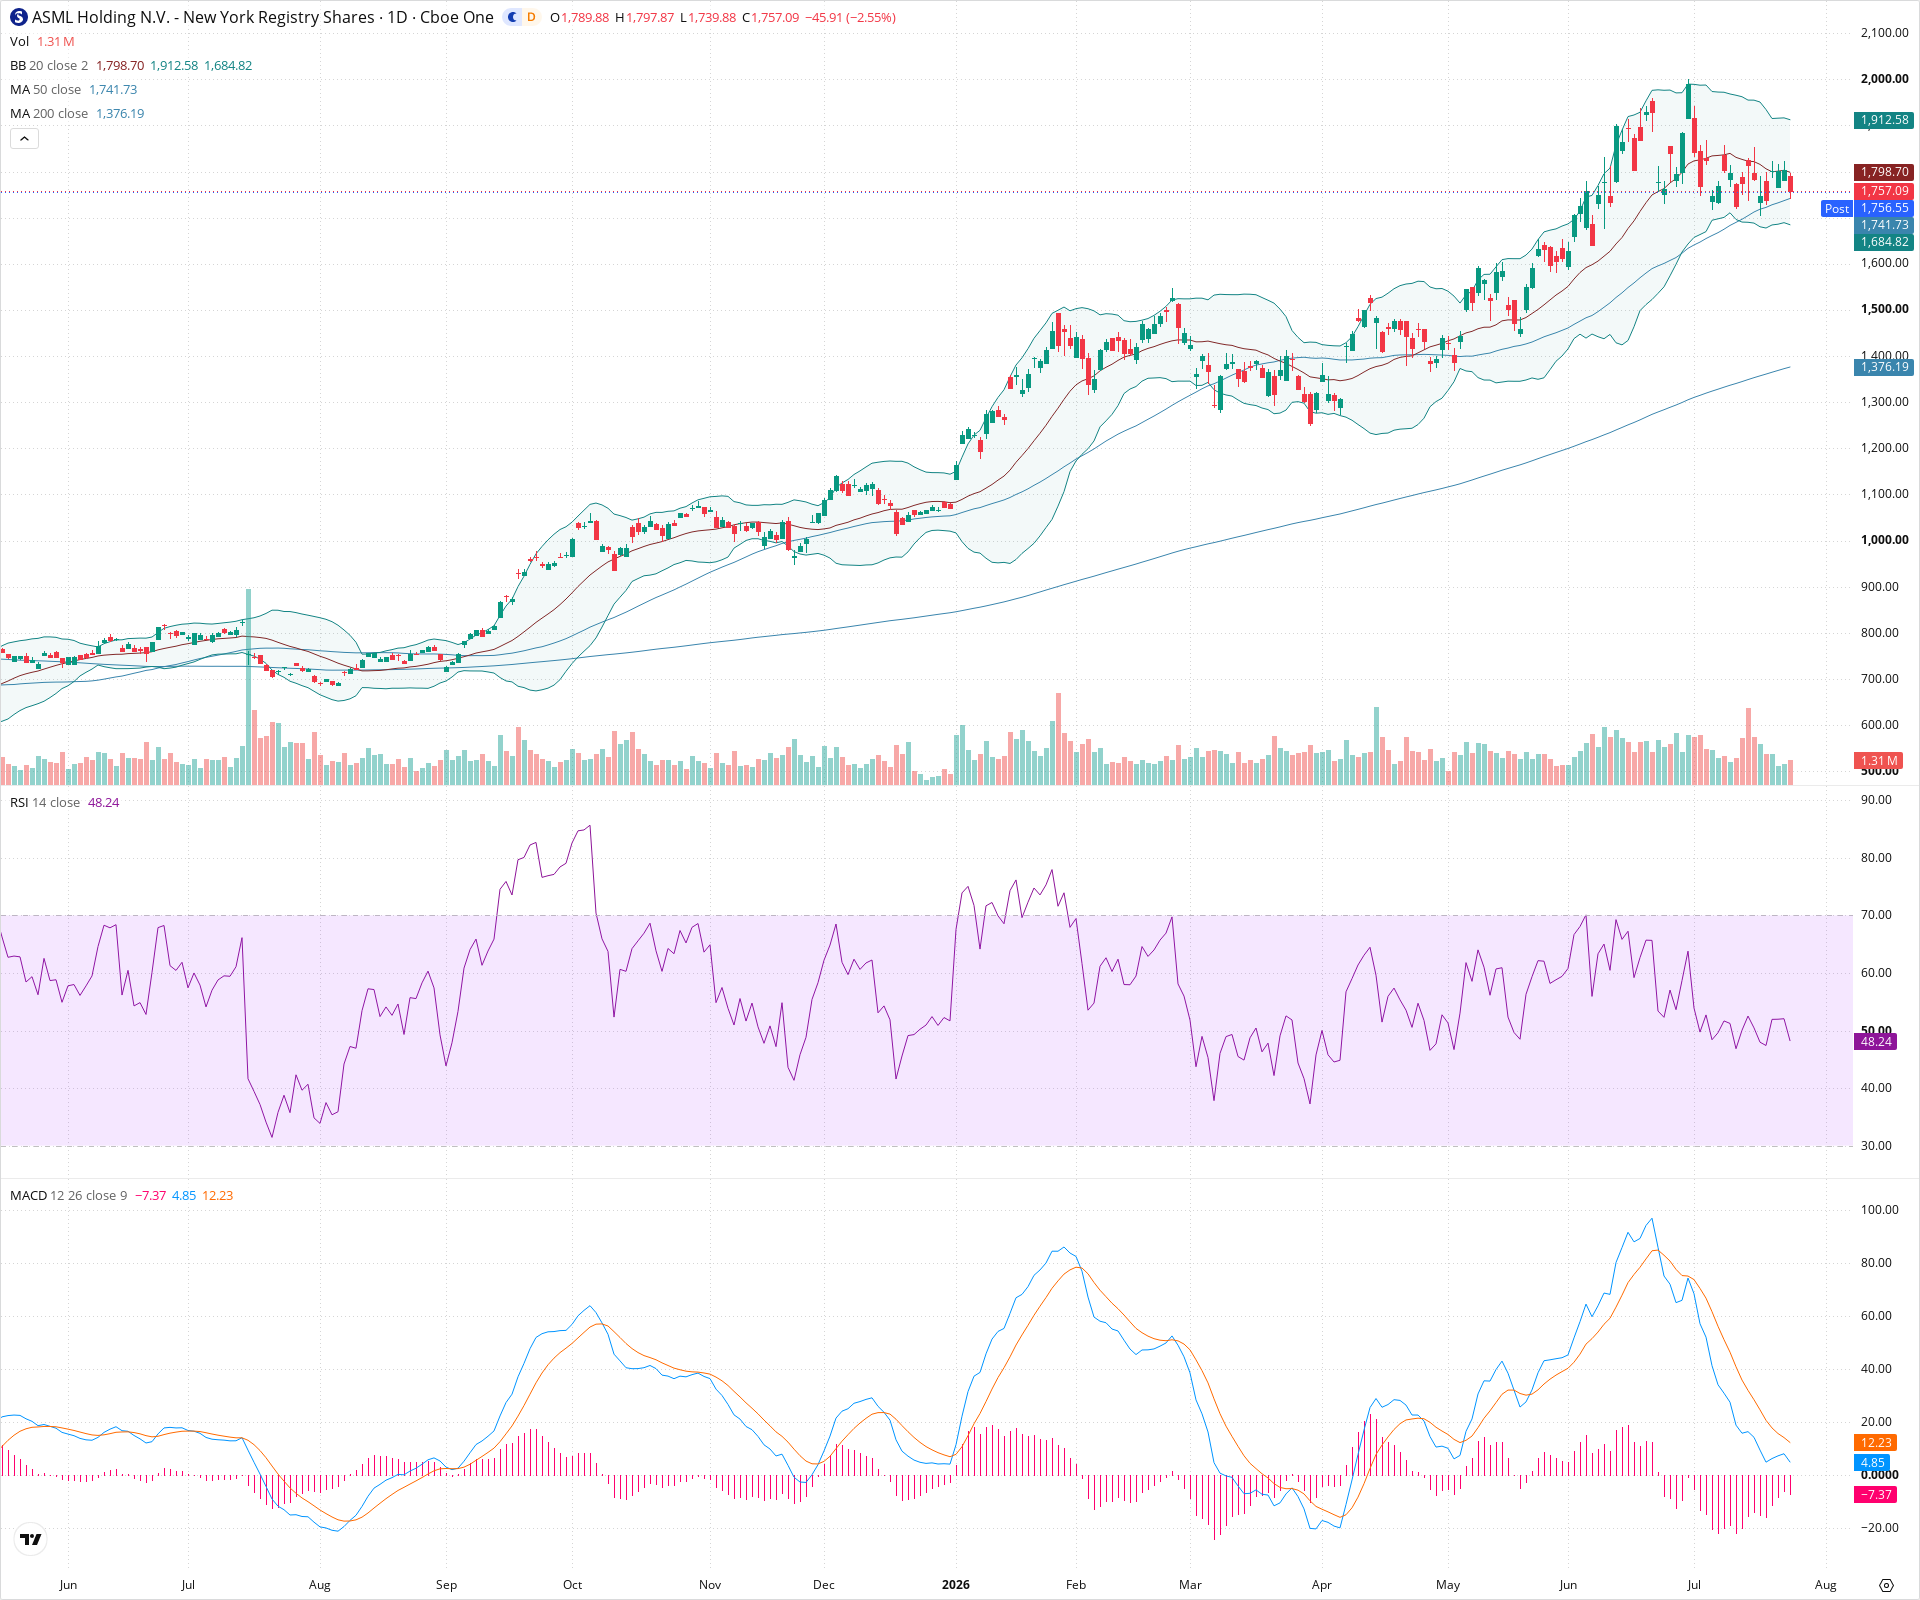
ASML remains in a robust long-term uptrend, clearly defined by its rising 200-day moving average. However, the stock is currently undergoing a short-term bearish correction, as evidenced by deteriorating RSI and MACD momentum indicators. The critical focal point for investors is the current test of the 50-day SMA support zone; a successful hold here could signal a resumption of the primary trend, while a decisive break may lead to a deeper retracement toward the 1600 level.
Included In Lists
Related Tickers of Interest
ASML Daily Chart
Sentiment
Short-term Sentiment (days to weeks): Bearish
Price has broken below the 20-day SMA, RSI is falling below 50, and MACD shows a bearish crossover with an expanding negative histogram, indicating downward momentum.
Long-term Sentiment (weeks to months): Bullish
The primary trend is strongly intact, with price trading significantly above consistently rising 50-day and 200-day moving averages.
Report Metadata
- Timeframe: daily
- Generated at: 2026-07-24T21:13:35.398Z
- Model: gemini-3.1-pro-preview
Support Price Levels
| Level | Range | Strength | Notes |
|---|---|---|---|
| $1,725.00 | $1,700.00 - $1,750.00 | Moderate | Current test area consisting of the rising 50-day SMA and a previous consolidation zone from late May. |
| $1,600.00 | $1,580.00 - $1,620.00 | Strong | Major prior structural support and consolidation area from April and early May. |
Resistance Price Levels
| Level | Range | Strength | Notes |
|---|---|---|---|
| $1,824.00 | $1,798.00 - $1,850.00 | Moderate | Immediate overhead resistance formed by the 20-day SMA and the recent breakdown level. |
| $1,975.00 | $1,950.00 - $2,000.00 | Strong | Recent all-time high zone and psychological resistance. |
Potential Chart Patterns in Formation
| Strength | Pattern | Signal | Target | Details |
|---|---|---|---|---|
| Moderate | Corrective Pullback | Neutral | N/A | Price is currently experiencing a standard pullback within a larger uptrend, retracing from recent highs to test the 50-day moving average. |
Frequently Asked Questions about ASML
What is the current sentiment for ASML?
The short-term sentiment for ASML is currently Bearish because Price has broken below the 20-day SMA, RSI is falling below 50, and MACD shows a bearish crossover with an expanding negative histogram, indicating downward momentum.. The long-term trend is classified as Bullish.
What are the key support levels for ASML?
StockDips.AI has identified key support levels for ASML at $1,725.00 and $1,600.00. These levels may represent potential accumulation zones where buying interest could emerge.
Is ASML in a significant dip or a Value Dip right now?
ASML has a Value Score of 68/100. It is not currently flagged as a significant dip in the Top Dips list. It is not listed as a Value Dip because the long-term sentiment or value-score threshold does not qualify.
View the full interactive analysis on StockDips.AI.