MU Daily Technical Analysis
Micron Technology Inc
American producer of computer memory and data storage solutions, including DRAM (dynamic random-access memory) and NAND flash memory products. Their products are essential for a wide range of applications, from personal computers and mobile devices to data centers and automotive systems.
MU Technical Analysis Summary
MU is currently undergoing a sharp and significant correction following a massive long-term run-up. A completed head and shoulders topping pattern has led to a breakdown below the 20-day and 50-day SMAs, shifting short-term momentum to decisively bearish. However, long-term investors may note that the macro trend remains bullish as long as the price stays above the rising 200-day SMA.
Included In Lists
Related Tickers of Interest
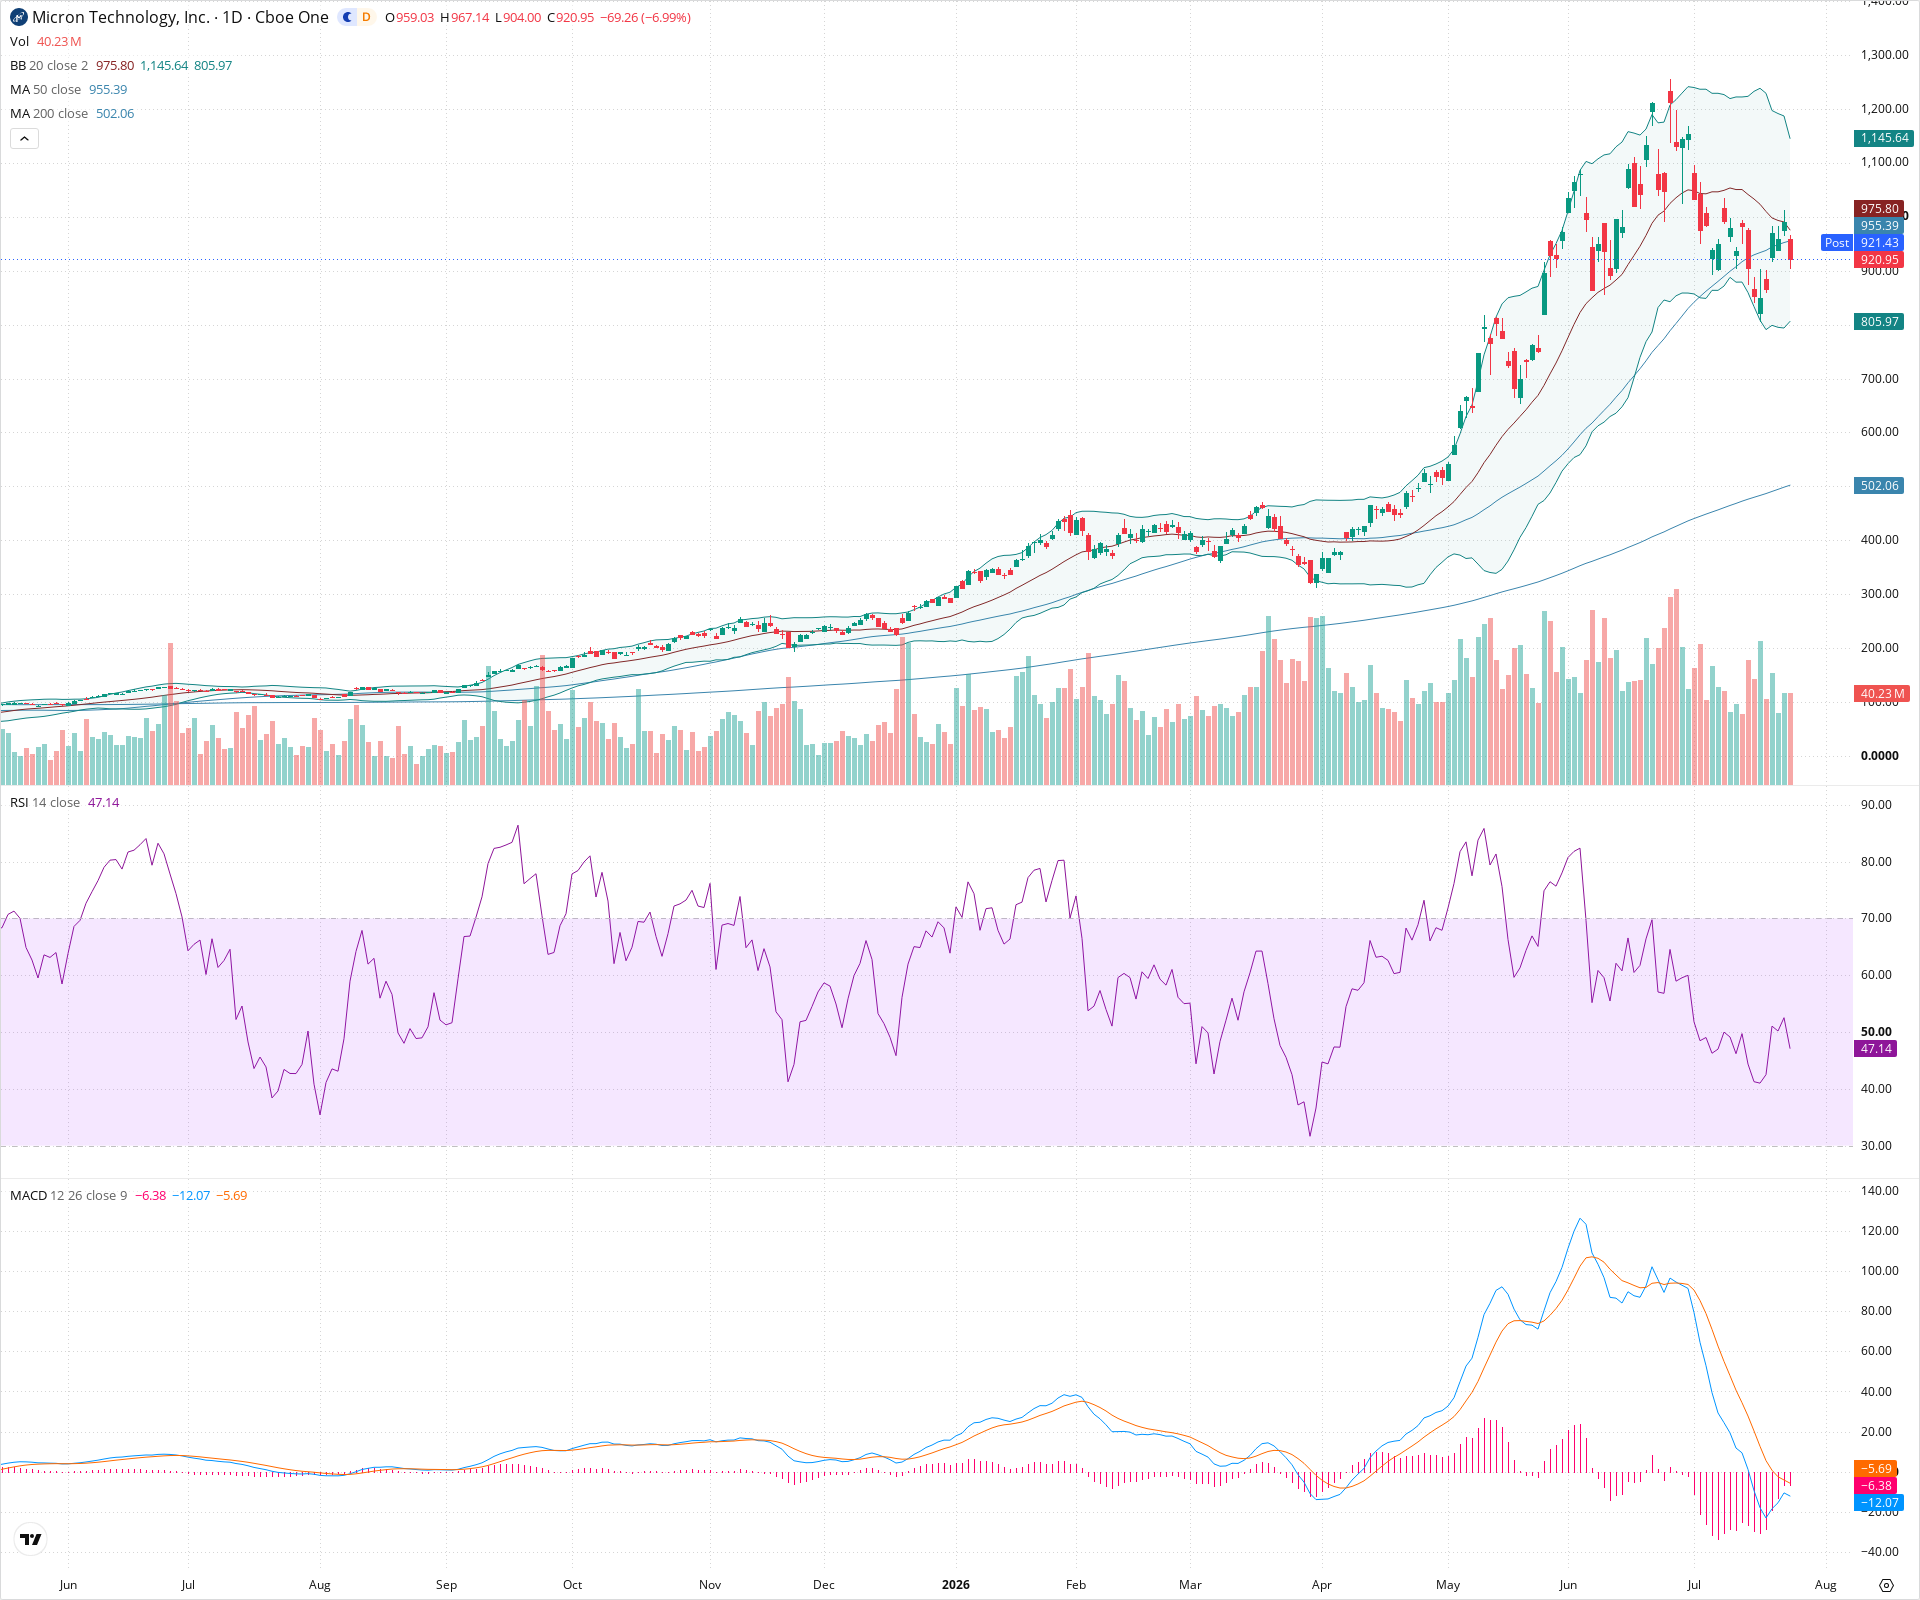
MU Daily Chart
Sentiment
Short-term Sentiment (days to weeks): Bearish
Price has recently broken below both the 20-day and 50-day SMAs, forming a series of lower highs and lower lows. MACD is deeply negative, and RSI remains below 50, indicating sustained downward momentum.
Long-term Sentiment (weeks to months): Bullish
Despite the severe recent correction, the price remains well above the 200-day SMA, which continues to slope upward, indicating the primary long-term uptrend is still intact.
Report Metadata
- Timeframe: daily
- Generated at: 2026-07-24T21:13:48.598Z
- Model: gemini-3.1-pro-preview
Support Price Levels
| Level | Range | Strength | Notes |
|---|---|---|---|
| $860.00 | $850.00 - $870.00 | Weak | Previous minor consolidation area established during the aggressive markup phase. |
| $765.00 | $750.00 - $780.00 | Strong | Major structural swing low and consolidation base before the steepest part of the rally. |
Resistance Price Levels
| Level | Range | Strength | Notes |
|---|---|---|---|
| $965.00 | $955.00 - $975.00 | Strong | Dynamic resistance zone currently populated by the downward-curling 20-day SMA and the 50-day SMA. |
| $1,125.00 | $1,100.00 - $1,150.00 | Strong | Previous major support shelf (neckline area) that recently broke down, now acting as strong overhead resistance. |
Potential Chart Patterns in Formation
| Strength | Pattern | Signal | Target | Details |
|---|---|---|---|---|
| Strong | Head and Shoulders Top | Bearish | N/A | A clear topping pattern with a left shoulder near 1100, head near 1300, and right shoulder near 1150. The neckline broke around 1100, triggering the current sharp markdown. |
Frequently Asked Questions about MU
What is the current sentiment for MU?
The short-term sentiment for MU is currently Bearish because Price has recently broken below both the 20-day and 50-day SMAs, forming a series of lower highs and lower lows. MACD is deeply negative, and RSI remains below 50, indicating sustained downward momentum.. The long-term trend is classified as Bullish.
What are the key support levels for MU?
StockDips.AI has identified key support levels for MU at $860.00 and $765.00. These levels may represent potential accumulation zones where buying interest could emerge.
Is MU in a significant dip or a Value Dip right now?
MU has a Value Score of 42/100. It is not currently flagged as a significant dip in the Top Dips list. It is not listed as a Value Dip because the long-term sentiment or value-score threshold does not qualify.
View the full interactive analysis on StockDips.AI.