SNDK Daily Technical Analysis
SanDisk Corp
Designs and manufactures flash memory products and solutions, including solid-state drives (SSDs), memory cards, and USB flash drives. The company develops products for a wide range of applications, from consumer electronics to high-growth data centers and AI computing.
SNDK Technical Analysis Summary
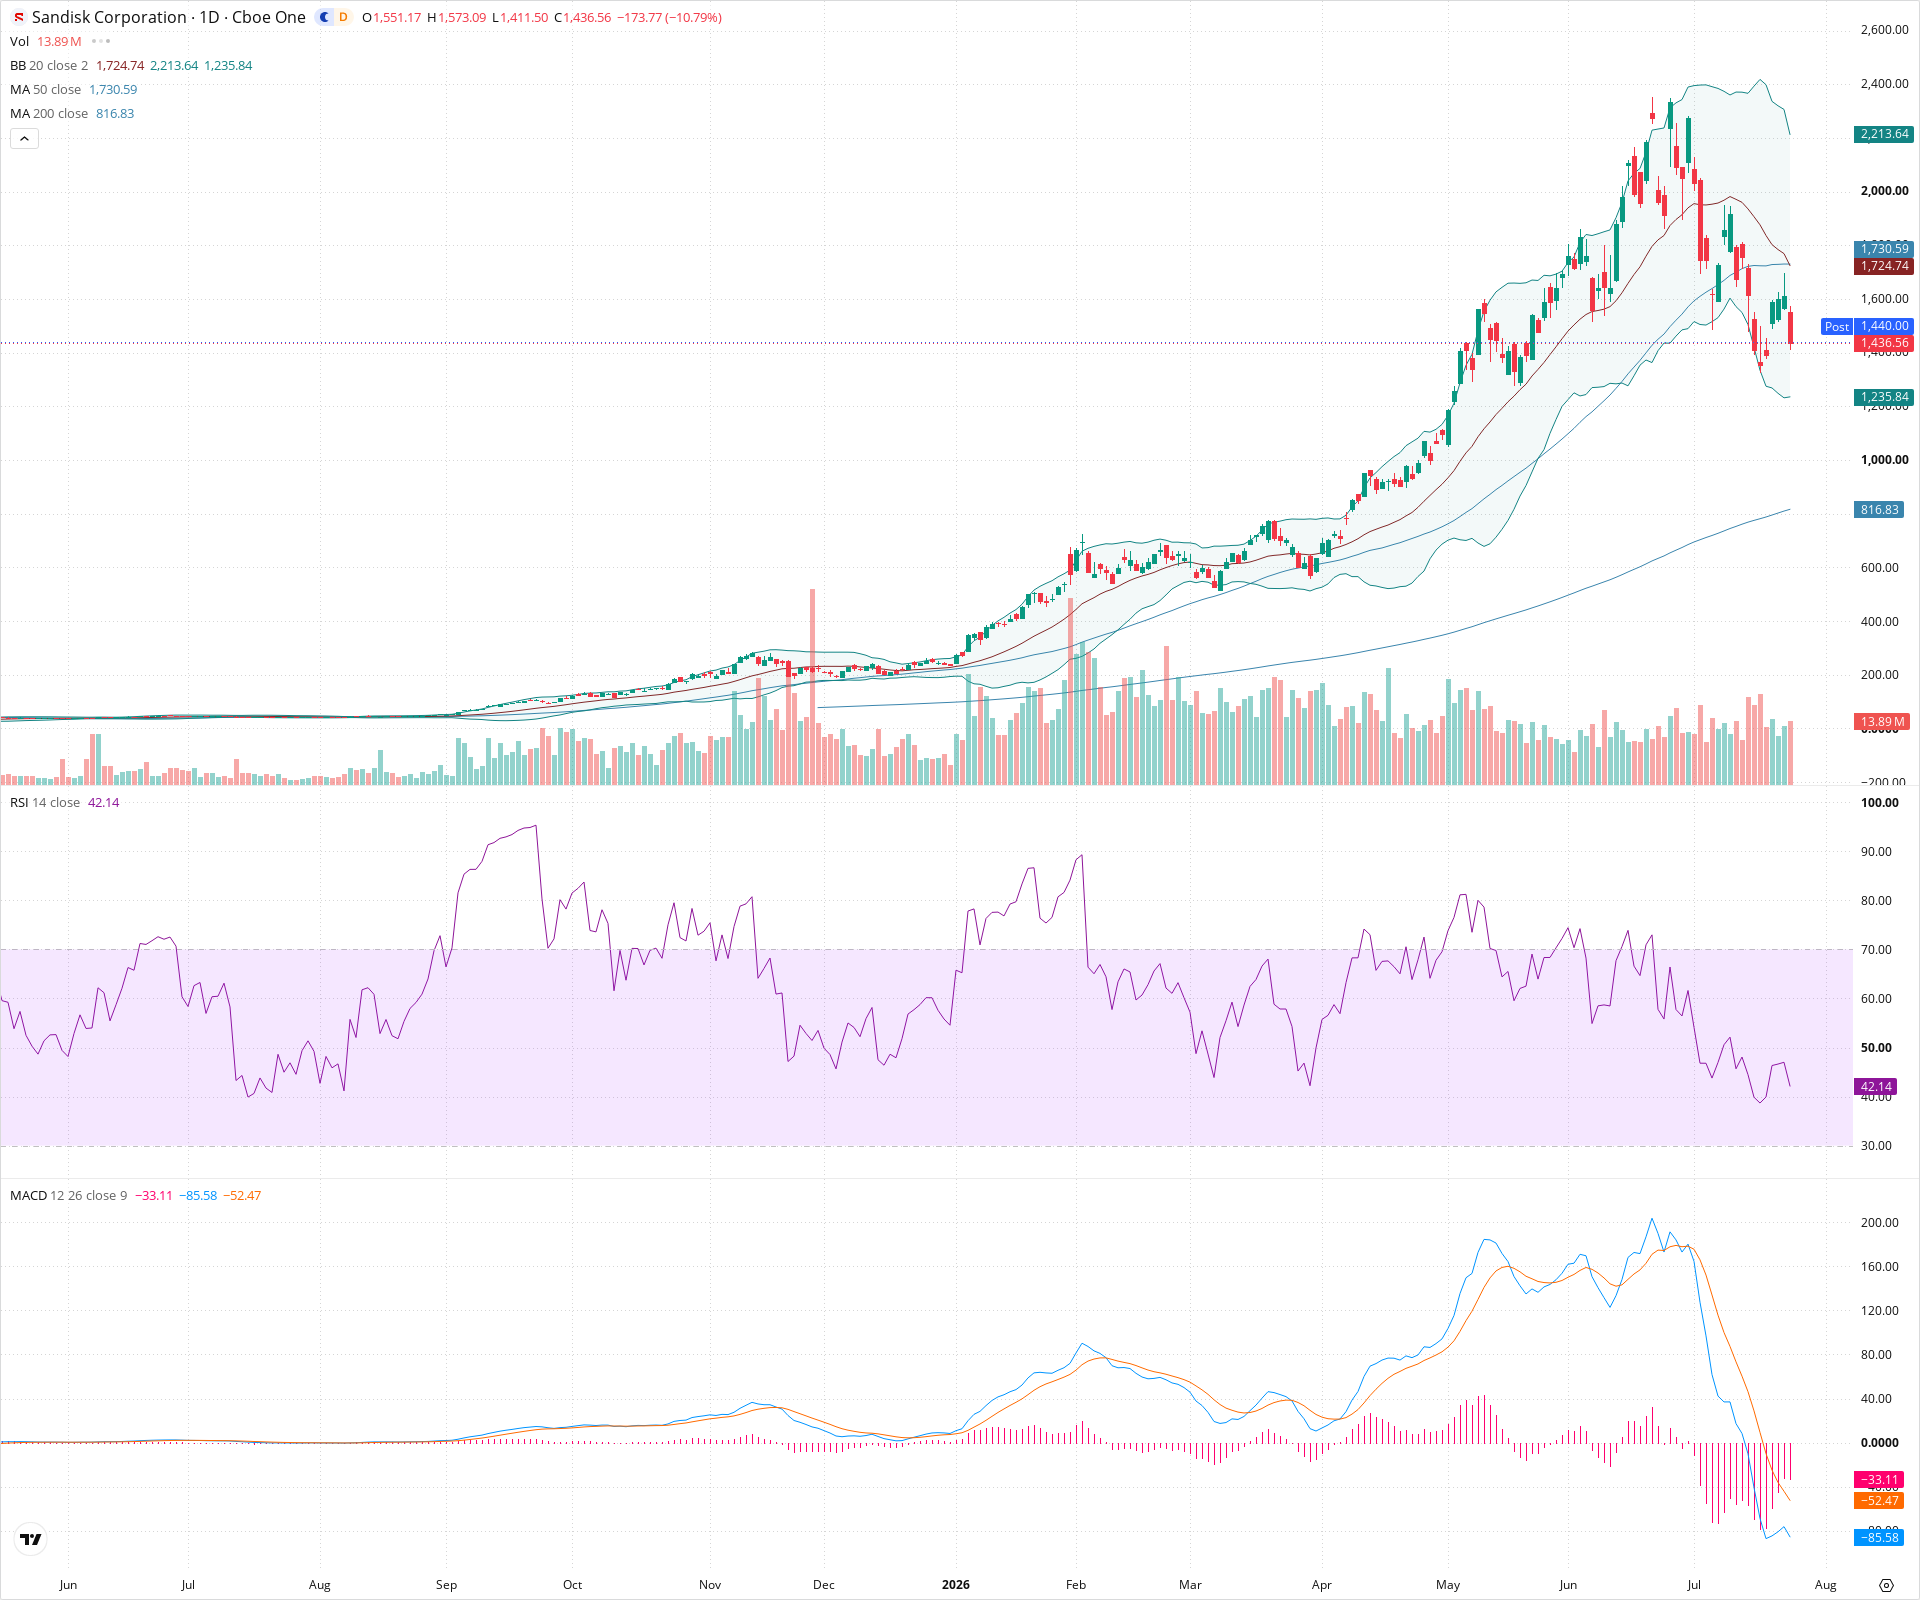
SNDK is currently undergoing a violent short-term correction following a massive parabolic rally. Technicals are decidedly bearish in the near term, with price breaking major support levels on high volume and confirming downward momentum via a sharply negative MACD. However, for long-term investors, the primary trend remains bullish as the stock is still well above its rising 200-day moving average. The current price action suggests a necessary, albeit painful, mean reversion to wash out excess speculation before attempting to establish a new structural base at lower levels.
Included In Lists
Related Tickers of Interest
SNDK Daily Chart
Sentiment
Short-term Sentiment (days to weeks): Bearish
The price has suffered a severe, high-volume breakdown, falling sharply below both the 20-day and 50-day SMAs. It is currently riding the lower Bollinger Band, while the MACD has crossed bearishly and is showing expanding negative momentum.
Long-term Sentiment (weeks to months): Bullish
Despite the violent short-term correction, the macro trend remains upward as the price is still trading significantly above a steadily rising 200-day SMA, indicating the broader structural uptrend is intact.
Report Metadata
- Timeframe: daily
- Generated at: 2026-07-24T21:09:23.498Z
- Model: gemini-3.1-pro-preview
Support Price Levels
| Level | Range | Strength | Notes |
|---|---|---|---|
| $1,200.00 | $1,150.00 - $1,250.00 | Strong | A previous zone of consolidation and minor swing lows established before the final parabolic advance in early June. |
| $1,025.00 | $1,000.00 - $1,050.00 | Strong | A structural base and consolidation area from April and May that served as a launchpad for the recent major uptrend. |
Resistance Price Levels
| Level | Range | Strength | Notes |
|---|---|---|---|
| $1,725.00 | $1,700.00 - $1,750.00 | Strong | This zone contains the recently broken 50-day and 20-day SMAs, which will likely act as significant overhead resistance on any corrective bounce. |
| $2,350.00 | $2,300.00 - $2,400.00 | Strong | The recent all-time high distribution zone where the uptrend exhausted itself. |
Potential Chart Patterns in Formation
| Strength | Pattern | Signal | Target | Details |
|---|---|---|---|---|
| Strong | Parabolic Breakdown | Bearish | N/A | Price advanced vertically over several weeks and is now exhibiting a symmetrical, sharp mean-reversion crash, breaking key short-term moving averages. |
| Strong | Death Cross (Pending) | Bearish | N/A | The fast 20-day SMA is turning sharply downward and is very close to crossing below the slower 50-day SMA, confirming a shift in medium-term momentum. |
Frequently Asked Questions about SNDK
What is the current sentiment for SNDK?
The short-term sentiment for SNDK is currently Bearish because The price has suffered a severe, high-volume breakdown, falling sharply below both the 20-day and 50-day SMAs. It is currently riding the lower Bollinger Band, while the MACD has crossed bearishly and is showing expanding negative momentum.. The long-term trend is classified as Bullish.
What are the key support levels for SNDK?
StockDips.AI has identified key support levels for SNDK at $1,200.00 and $1,025.00. These levels may represent potential accumulation zones where buying interest could emerge.
Is SNDK in a significant dip or a Value Dip right now?
SNDK has a Value Score of 55/100. It is not currently flagged as a significant dip in the Top Dips list. It is not listed as a Value Dip because the long-term sentiment or value-score threshold does not qualify.
View the full interactive analysis on StockDips.AI.