BE Daily Technical Analysis
Bloom Energy Corp
Bloom Energy Corporation designs, manufactures, and installs solid oxide fuel cell platforms for on-site, distributed power generation. Its flagship Energy Servers provide fuel-flexible, highly reliable baseload electricity from natural gas, biogas, or hydrogen, serving mission-critical facilities, industrial operations, and AI data centers.
BE Technical Analysis Summary
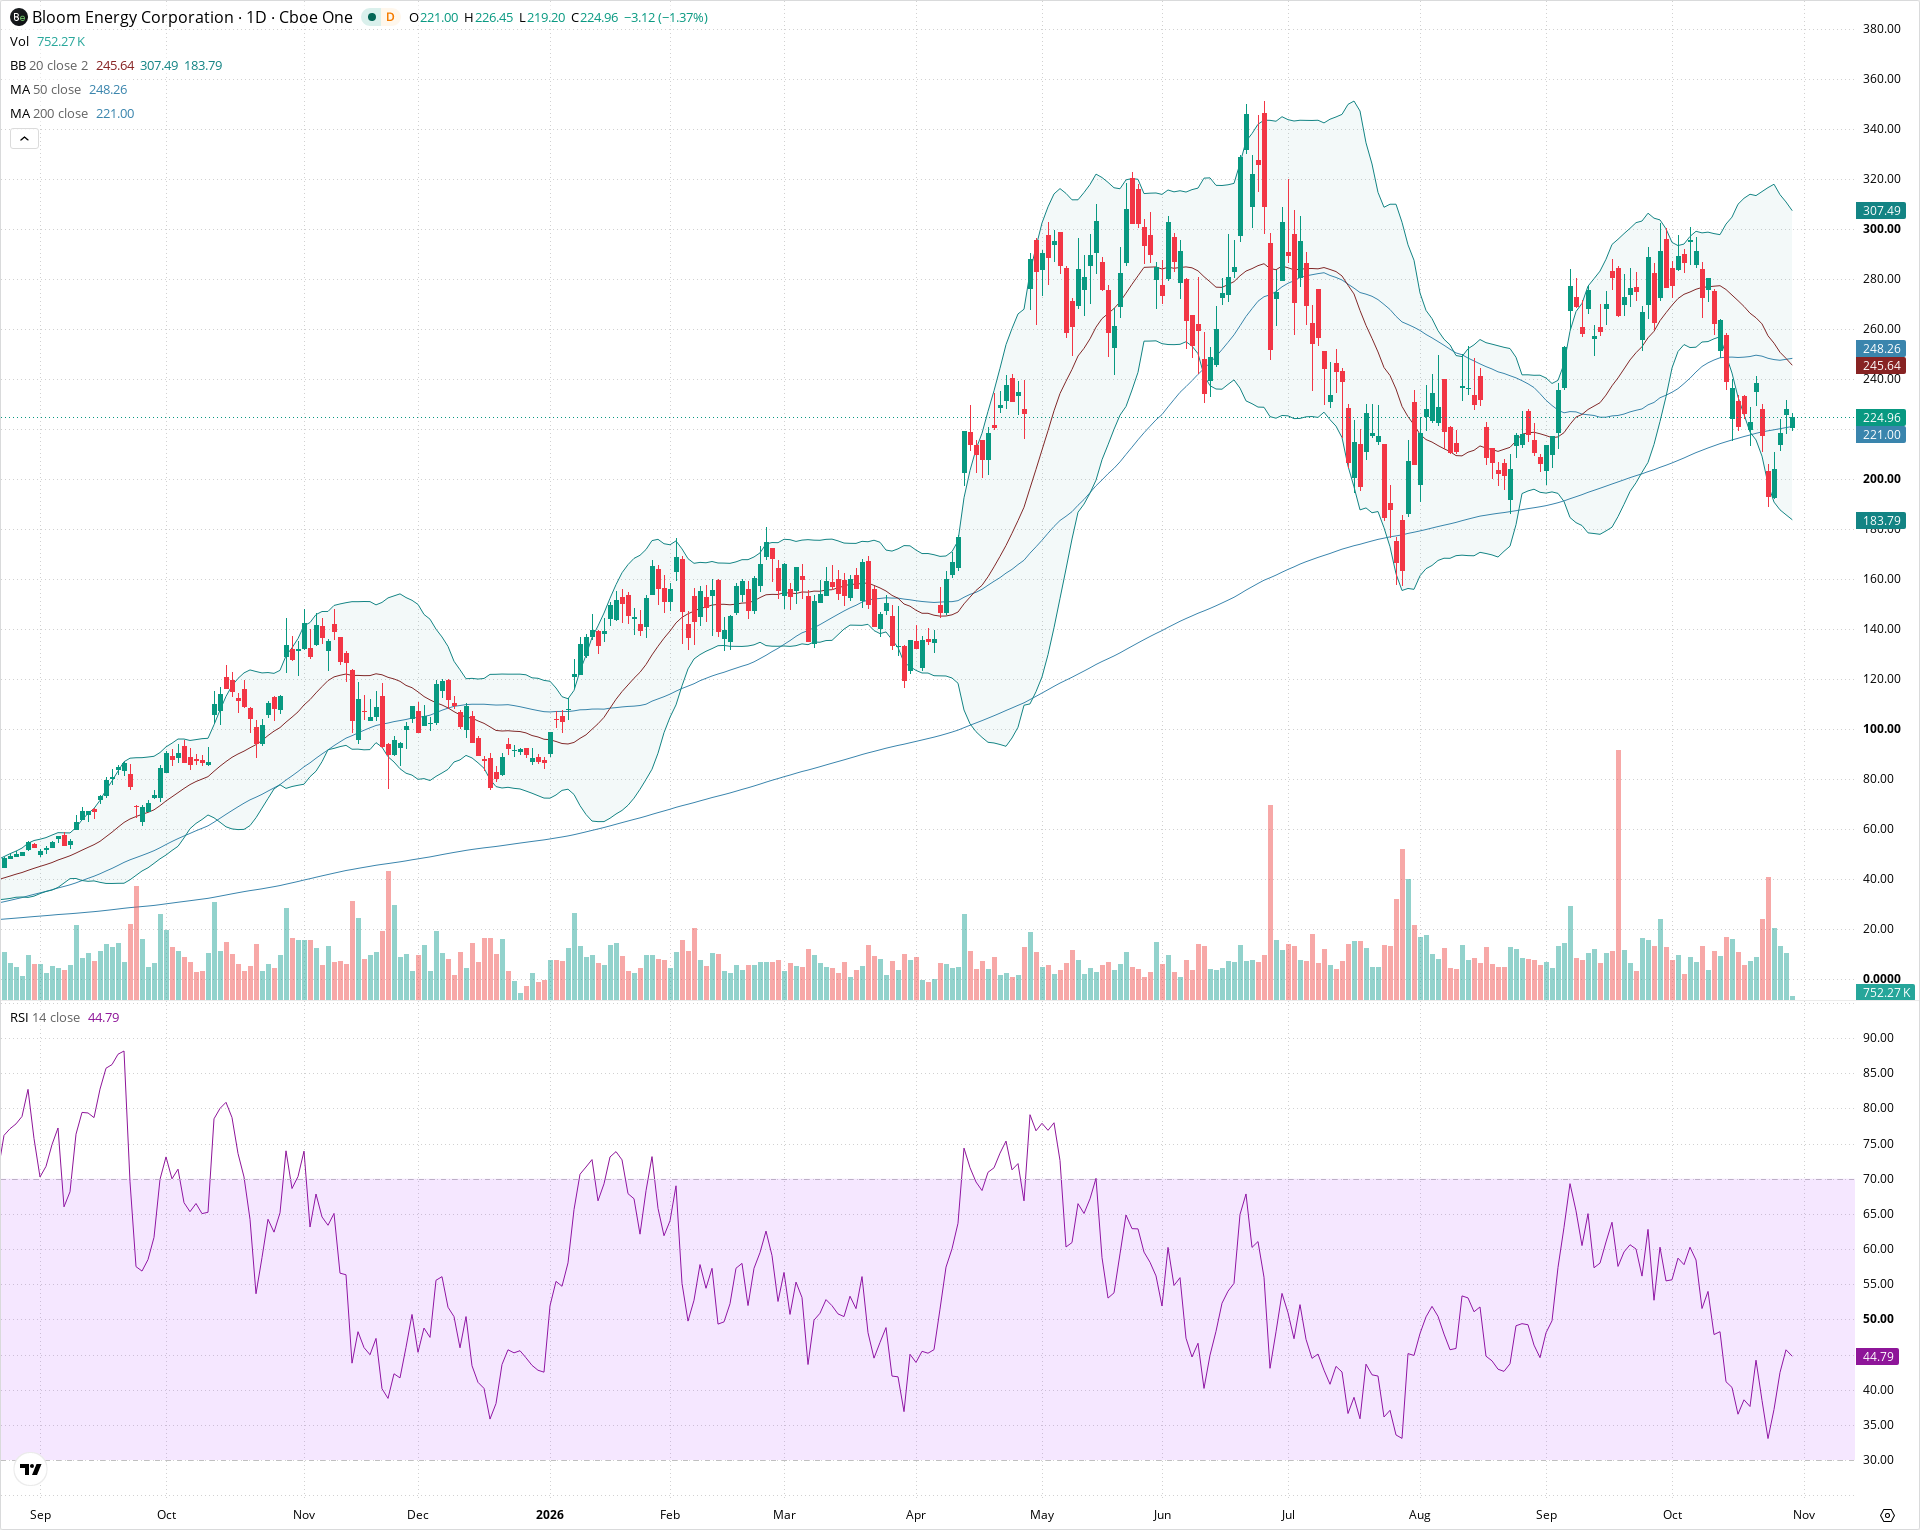
Bloom Energy is attempting to stabilize after testing major multi-month support in the 190-200 range, successfully reclaiming its upward-trending 200-day SMA at 221.00. While the broader uptrend remains intact with moving averages in a long-term bullish orientation, short-term momentum faces significant overhead resistance around the 245-250 zone formed by the 20-day and 50-day SMAs. A decisive breakout above 250 would confirm renewed upside momentum toward the 300 level, while a failure to hold 218-221 would risk retesting the key 200 support floor.
Included In Lists
Related Tickers of Interest
BE Daily Chart
Sentiment
Short-term Sentiment (days to weeks): Neutral
Price is rebounding from recent lows below 200 and reclaiming the 200-day SMA, but remains capped below the downward-sloping 20-day and 50-day moving averages with an RSI at 44.79.
Long-term Sentiment (weeks to months): Bullish
The 200-day SMA continues to slope upward, the 50-day SMA remains positioned above the 200-day SMA, and key multi-month structural support near 190-200 has repeatedly held.
Report Metadata
- Timeframe: daily
- Generated at: 2026-10-29T13:49:11.321Z
- Model: gemini-3.8-flash
Support Price Levels
| Level | Range | Strength | Notes |
|---|---|---|---|
| $220.00 | $218.00 - $222.00 | Moderate | Aligns with the upward-sloping 200-day simple moving average (221.00) and recent daily candle lows. |
| $196.00 | $190.00 - $202.00 | Strong | Major horizontal support zone established by swing lows in late July, early August, and late October. |
Resistance Price Levels
| Level | Range | Strength | Notes |
|---|---|---|---|
| $247.50 | $245.00 - $250.00 | Strong | Confluence of the descending 20-day SMA (245.64) and 50-day SMA (248.26), representing a key breakdown level. |
| $301.00 | $295.00 - $307.00 | Strong | September swing highs and proximity to the upper Bollinger Band. |
Potential Chart Patterns in Formation
| Strength | Pattern | Signal | Target | Details |
|---|---|---|---|---|
| Moderate | Double Bottom | Bullish | $295.00 | Price formed a secondary low near the 195-200 region in late October, mirroring the July-August troughs before reversing upward. |
Frequently Asked Questions about BE
What is the current sentiment for BE?
The short-term sentiment for BE is currently Neutral because Price is rebounding from recent lows below 200 and reclaiming the 200-day SMA, but remains capped below the downward-sloping 20-day and 50-day moving averages with an RSI at 44.79.. The long-term trend is classified as Bullish.
What are the key support levels for BE?
StockDips.AI has identified key support levels for BE at $220.00 and $196.00. These levels may represent potential accumulation zones where buying interest could emerge.
Is BE in a significant dip or a Value Dip right now?
BE has a Value Score of 100/100. It is not currently flagged as a significant dip in the Top Dips list. It is not listed as a Value Dip because the long-term sentiment or value-score threshold does not qualify.
View the full interactive analysis on StockDips.AI.