SPCX Daily Technical Analysis
Space Exploration Technologies Corp
Space Exploration Technologies Corp. (SpaceX) designs, manufactures, and launches reusable orbital rockets and spacecraft, and operates the Starlink satellite internet constellation. Following its integration with xAI and X Corp., the company also develops artificial intelligence models (Grok), large-scale compute infrastructure (Colossus), and next-generation space-based computing technologies.
SPCX Technical Analysis Summary
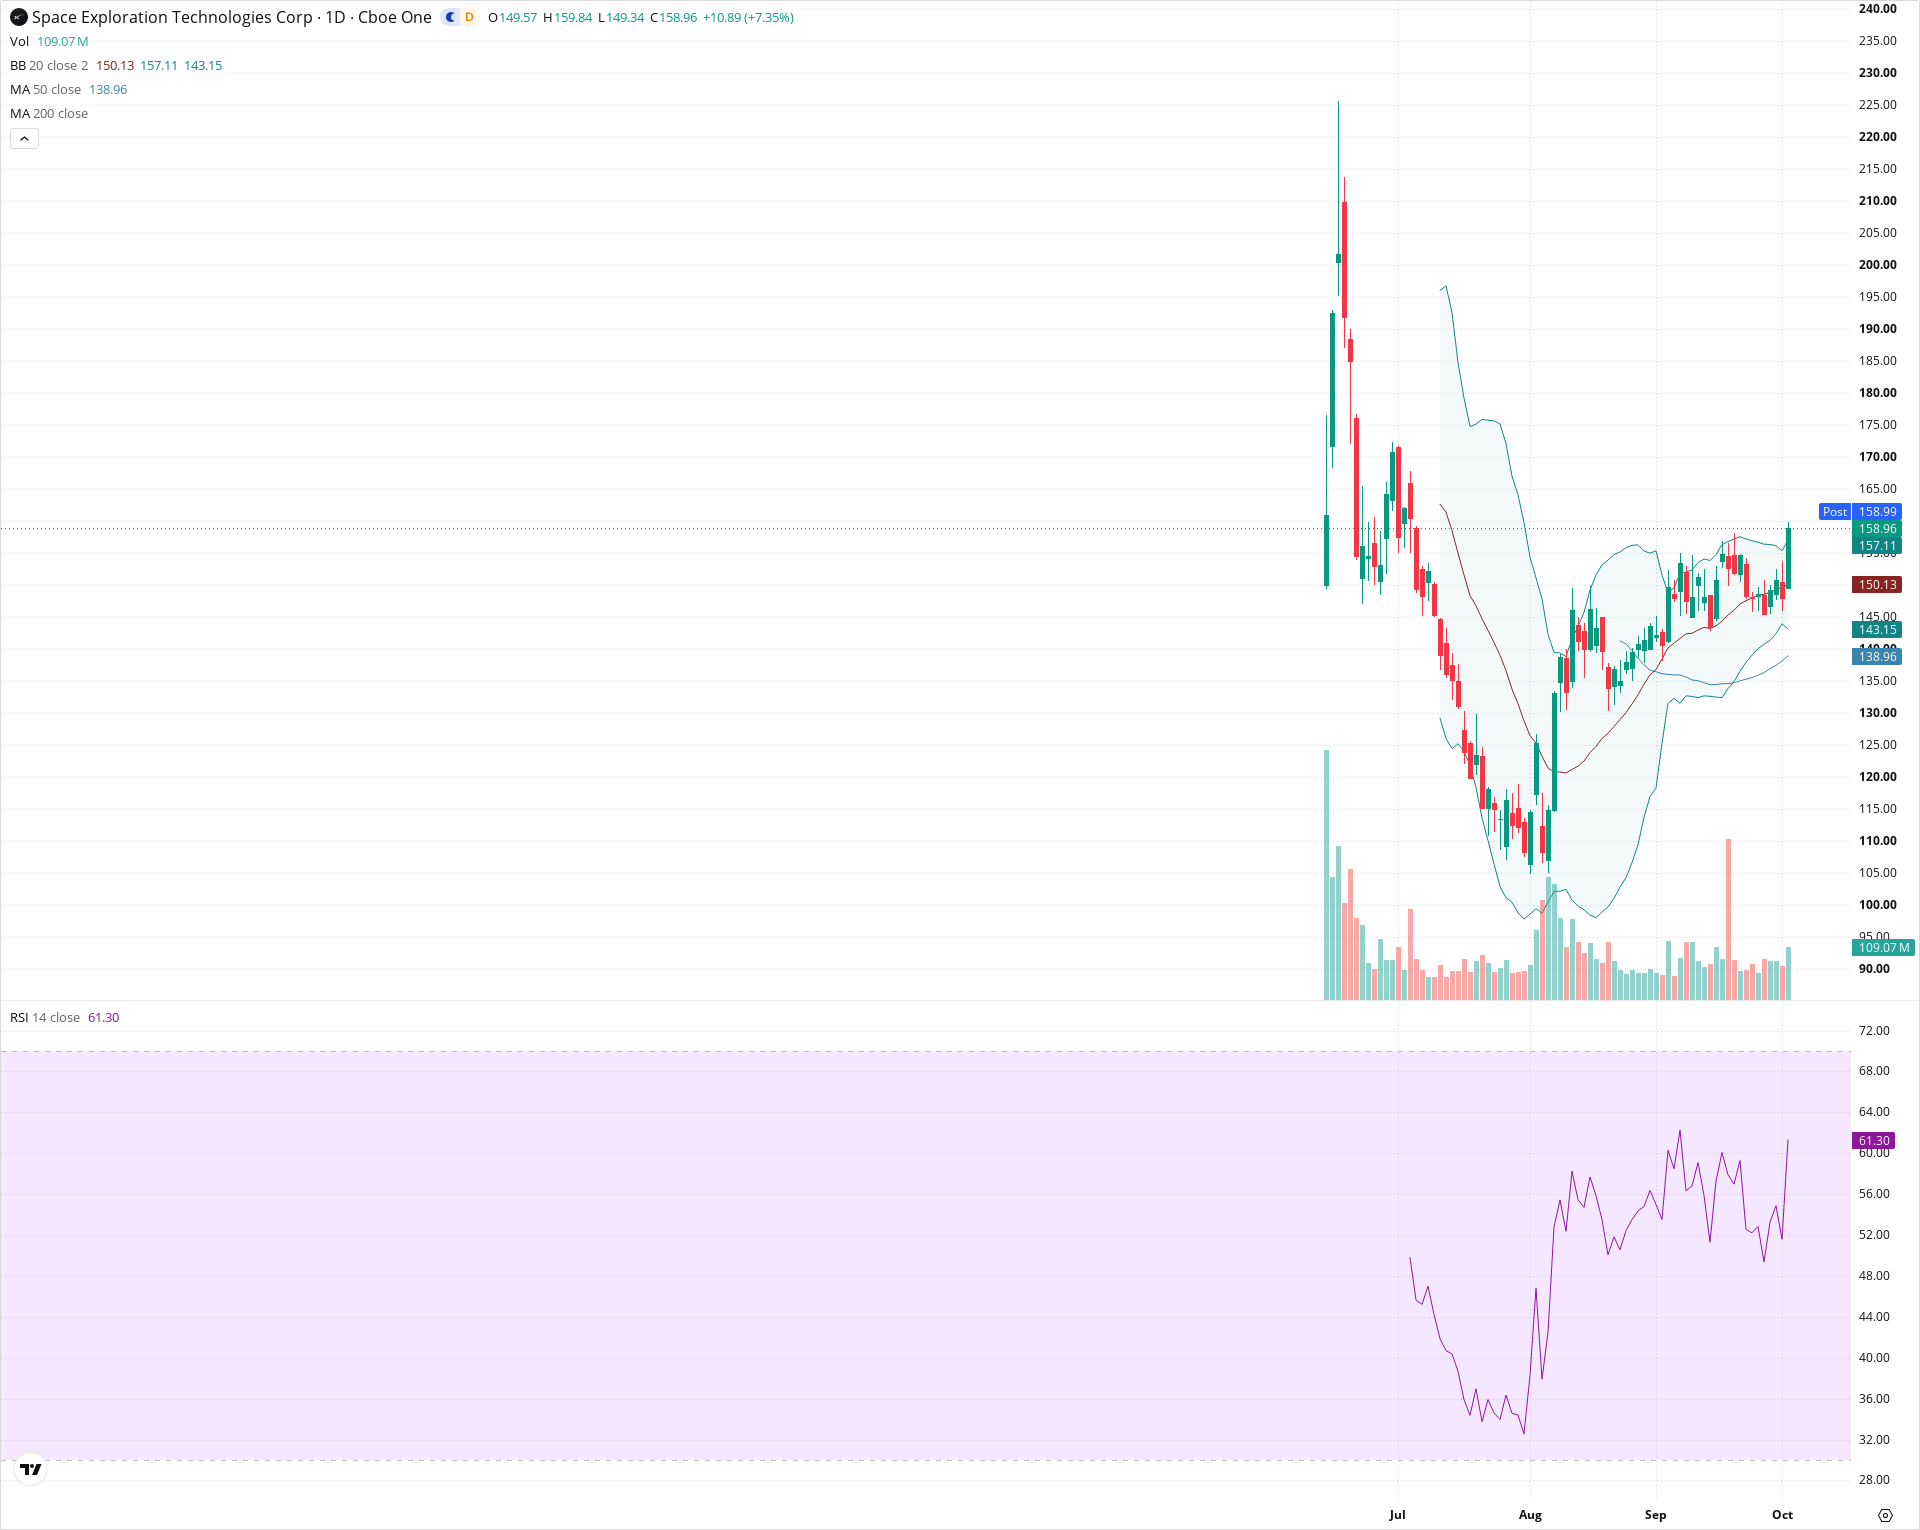
SPCX has firmly transitioned out of its post-listing decline, establishing a sustainable recovery trend above its rising 50-day moving average. The recent breakout past 155.00 confirms bullish continuation from a multi-week consolidation base. While short-term pullbacks toward the 150.00 support zone remain possible due to upper band stretching, the broader trajectory favors further upside toward the 168.00–175.00 resistance region.
Included In Lists
Related Tickers of Interest
SPCX Daily Chart
Sentiment
Short-term Sentiment (days to weeks): Bullish
Price broke out above the upper Bollinger Band with a strong wide-range green candle, supported by rising 20-day SMA and RSI momentum holding comfortably above 60.
Long-term Sentiment (weeks to months): Bullish
The market has completed a major bottoming formation near 106.00, consistently forming higher swing lows and trading well above the upward-sloping 50-day moving average.
Report Metadata
- Timeframe: daily
- Generated at: 2026-10-02T20:21:20.169Z
- Model: gemini-3.8-flash
Support Price Levels
| Level | Range | Strength | Notes |
|---|---|---|---|
| $149.75 | $148.00 - $151.50 | Moderate | Confluence of recent consolidation support and the 20-day moving average (150.13). |
| $140.00 | $137.00 - $143.00 | Strong | Previous accumulation shelf aligned with the lower Bollinger Band and rising 50-day SMA (138.96). |
| $109.00 | $106.00 - $112.00 | Strong | Major structural swing low formed during late July and early August. |
Resistance Price Levels
| Level | Range | Strength | Notes |
|---|---|---|---|
| $171.50 | $168.00 - $175.00 | Moderate | Horizontal resistance level marked by the mid-July consolidation and lower-high peak. |
| $190.00 | $185.00 - $195.00 | Strong | Sharp breakdown origin zone from the post-IPO sell-off. |
Potential Chart Patterns in Formation
| Strength | Pattern | Signal | Target | Details |
|---|---|---|---|---|
| Strong | Rounding Bottom / Trend Reversal | Bullish | $175.00 | Price transitioned from an aggressive downtrend into a rounded base around 106-115, followed by a sequence of higher highs and higher lows. |
| Moderate | Consolidation Range Breakout | Bullish | $168.00 | A breakout above the September trading range ceiling (~155.00) closing directly outside the upper Bollinger Band. |
Frequently Asked Questions about SPCX
What is the current sentiment for SPCX?
The short-term sentiment for SPCX is currently Bullish because Price broke out above the upper Bollinger Band with a strong wide-range green candle, supported by rising 20-day SMA and RSI momentum holding comfortably above 60.. The long-term trend is classified as Bullish.
What are the key support levels for SPCX?
StockDips.AI has identified key support levels for SPCX at $149.75 and $140.00. These levels may represent potential accumulation zones where buying interest could emerge.
Is SPCX in a significant dip or a Value Dip right now?
SPCX has a Value Score of 58/100. It is not currently flagged as a significant dip in the Top Dips list. It is not listed as a Value Dip because the long-term sentiment or value-score threshold does not qualify.
View the full interactive analysis on StockDips.AI.