ORCL Daily Technical Analysis
Oracle Corporation
A global enterprise software and cloud infrastructure provider offering databases, ERP systems, and cloud services. Known for its mission-critical business software and rapidly growing Oracle Cloud Infrastructure (OCI).
ORCL Technical Analysis Summary
The technical posture for ORCL is severely bearish across multiple timeframes. The stock is experiencing aggressive selling pressure, pushing momentum indicators to extremes and breaking through recent minor consolidations. The immediate focus is on the critical 100-115 historical support zone; failure to hold this level could precipitate further significant downside.
Included In Lists
Related Tickers of Interest
ORCL Daily Chart
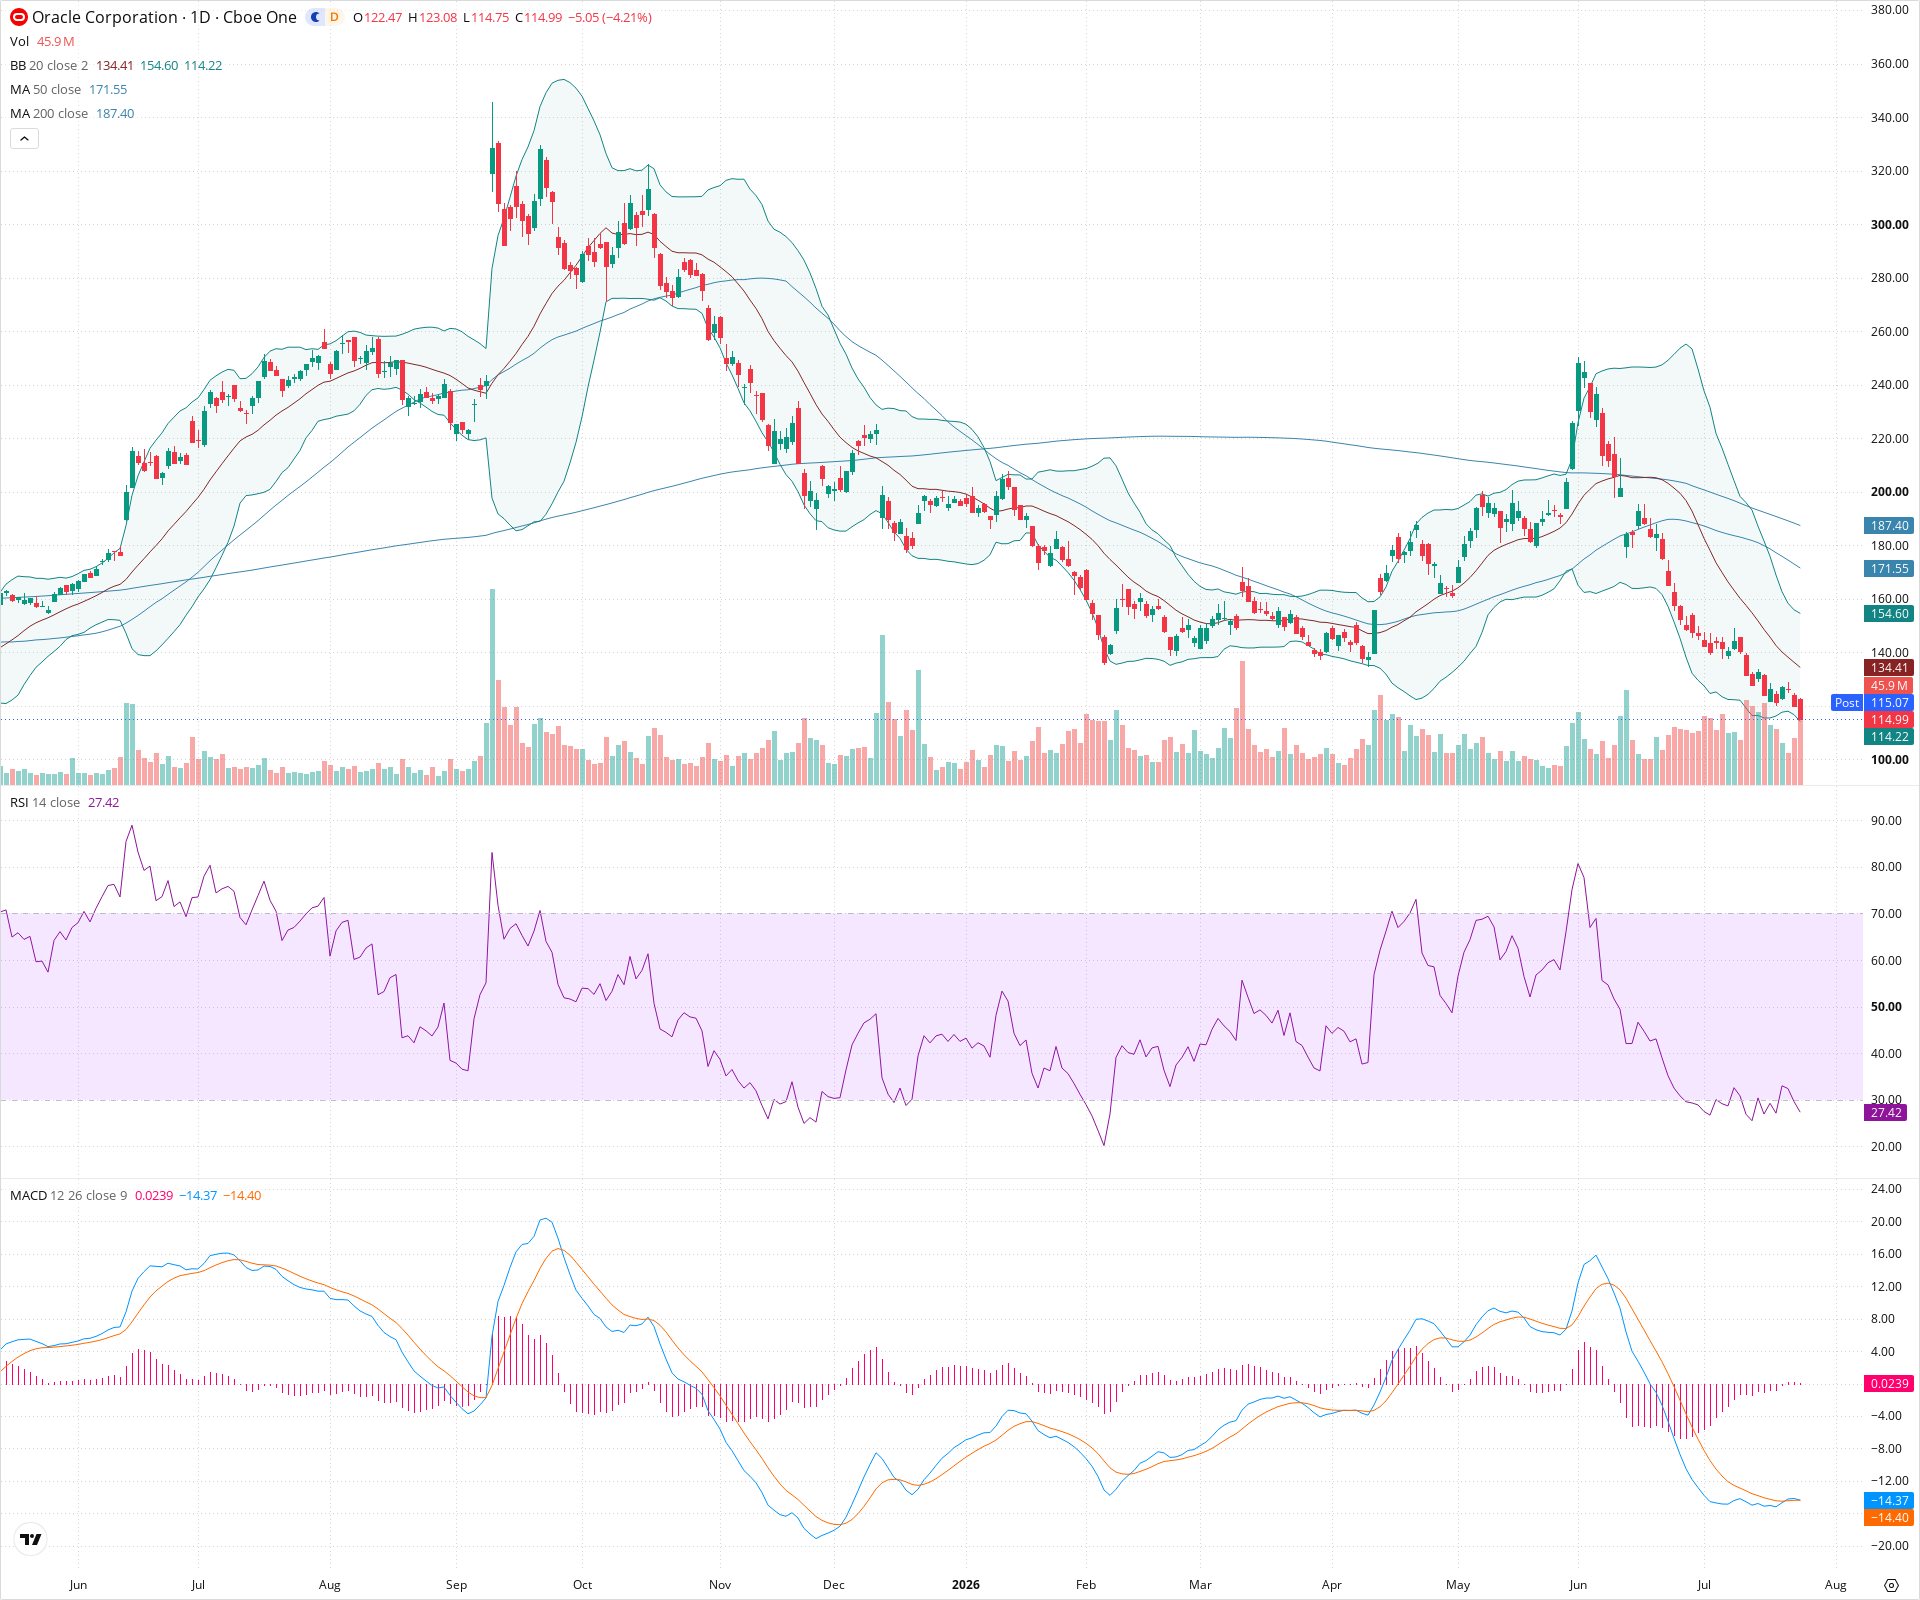
Sentiment
Short-term Sentiment (days to weeks): Bearish
Price is dropping sharply on elevated volume, riding the lower Bollinger Band. Momentum indicators confirm weakness, with RSI in oversold territory (27.42) and pointing down, while the MACD histogram expands negatively alongside bearish moving average alignment.
Long-term Sentiment (weeks to months): Bearish
The stock is entrenched in a macro downtrend, evidenced by a series of lower highs and lower lows. Price remains well below the 50-day and 200-day SMAs, both of which are sloping downwards, indicating sustained long-term selling pressure.
Report Metadata
- Timeframe: daily
- Generated at: 2026-07-24T21:12:49.298Z
- Model: gemini-3.1-pro-preview
Support Price Levels
| Level | Range | Strength | Notes |
|---|---|---|---|
| $107.50 | $100.00 - $115.00 | Strong | Critical historical support zone representing the major swing low established earlier in the year. The current price is testing the upper boundary of this zone. |
Resistance Price Levels
| Level | Range | Strength | Notes |
|---|---|---|---|
| $135.00 | $130.00 - $140.00 | Strong | Immediate resistance formed by the recent breakdown level, coinciding closely with the rapidly descending 20-day SMA. |
| $180.00 | $170.00 - $190.00 | Strong | Major dynamic resistance zone encompassing the declining 50-day and 200-day SMAs. |
Potential Chart Patterns in Formation
| Strength | Pattern | Signal | Target | Details |
|---|---|---|---|---|
| Strong | Bearish Breakdown | Bearish | $100.00 | Price recently broke down from a multi-week consolidation/bounce phase, accelerating downwards on increasing volume, confirming continuation of the dominant downtrend. |
| Strong | Macro Downtrend Structure | Bearish | N/A | A persistent pattern of lower highs and lower lows since the peak, contained below downward-sloping long-term moving averages. |
Frequently Asked Questions about ORCL
What is the current sentiment for ORCL?
The short-term sentiment for ORCL is currently Bearish because Price is dropping sharply on elevated volume, riding the lower Bollinger Band. Momentum indicators confirm weakness, with RSI in oversold territory (27.42) and pointing down, while the MACD histogram expands negatively alongside bearish moving average alignment.. The long-term trend is classified as Bearish.
What are the key support levels for ORCL?
StockDips.AI has identified key support levels for ORCL at $107.50. These levels may represent potential accumulation zones where buying interest could emerge.
Is ORCL in a significant dip or a Value Dip right now?
ORCL has a Value Score of 73/100. It is currently flagged as a significant dip in the Top Dips list. It is not listed as a Value Dip because the long-term sentiment or value-score threshold does not qualify.
View the full interactive analysis on StockDips.AI.