NUAI Daily Technical Analysis
New Era Energy & Digital, Inc
Developer and operator of next-generation digital infrastructure and integrated power assets, focusing on building data centers to support AI and high-performance computing workloads. The company provides turnkey solutions to accelerate data center deployment for hyperscale, enterprise, and edge operators, leveraging its own natural gas reserves and land in the Permian Basin.
NUAI Technical Analysis Summary
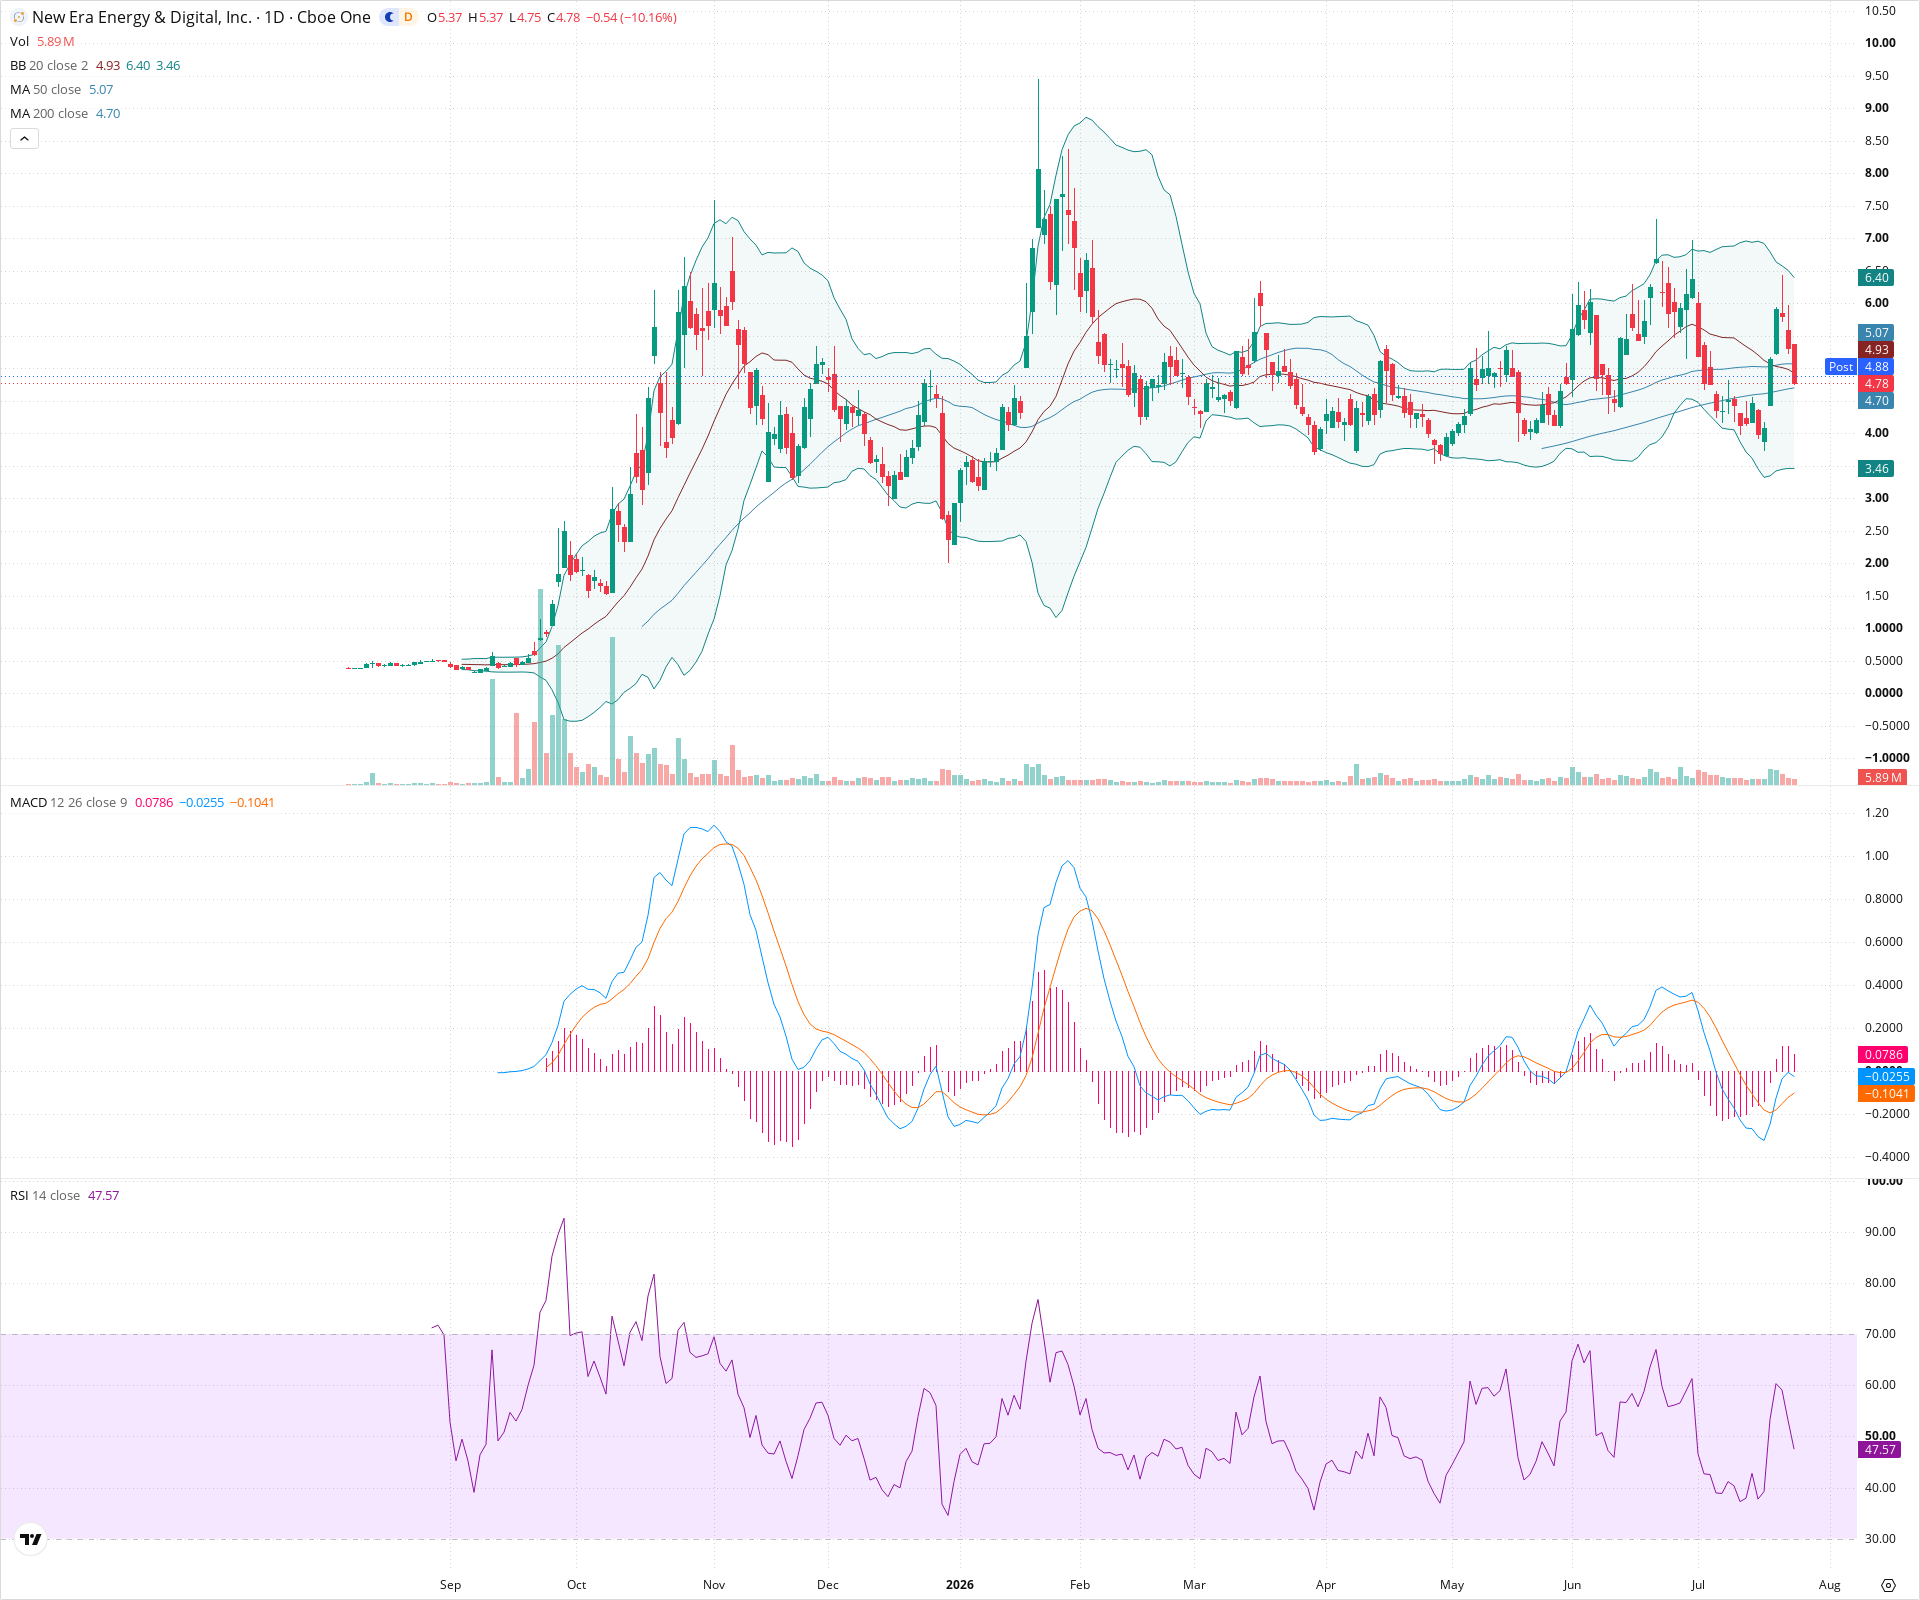
NUAI is currently undergoing a sharp short-term correction, having lost support at its 20-day and 50-day moving averages. The technical picture is currently hinging on the critical 200-day SMA support level near $4.70. A breakdown below this level could signal a deeper trend reversal, while a successful hold may present a consolidation opportunity. Short-term momentum indicators are heavily bearish, suggesting caution.
Included In Lists
Related Tickers of Interest
NUAI Daily Chart
Sentiment
Short-term Sentiment (days to weeks): Bearish
Price has sharply broken below both the 20-day and 50-day SMAs on expanding negative MACD momentum. RSI has crossed below 50, indicating sellers are in control short-term.
Long-term Sentiment (weeks to months): Neutral
While the 200-day SMA is still rising, indicating an underlying long-term uptrend, the current aggressive pullback is testing this critical support. A decisive break below the 200-day SMA would shift the long-term view to bearish.
Report Metadata
- Timeframe: daily
- Generated at: 2026-07-24T21:04:47.699Z
- Model: gemini-3.1-pro-preview
Support Price Levels
| Level | Range | Strength | Notes |
|---|---|---|---|
| $4.63 | $4.50 - $4.75 | Strong | Current test zone of the rising 200-day SMA and recent structural lows from May. |
| $3.95 | $3.80 - $4.10 | Strong | Major prior consolidation floor from December and January. |
Resistance Price Levels
| Level | Range | Strength | Notes |
|---|---|---|---|
| $5.02 | $4.93 - $5.10 | Weak | Immediate overhead resistance formed by the recently broken 20-day and 50-day SMAs. |
| $6.75 | $6.50 - $7.00 | Strong | Recent swing high zone establishing a lower high relative to the peak early in the year. |
Potential Chart Patterns in Formation
| Strength | Pattern | Signal | Target | Details |
|---|---|---|---|---|
| Strong | Moving Average Breakdown | Bearish | $4.50 | Price decisively broke down below the cluster of the 20-day and 50-day SMAs after a period of consolidation, accompanied by bearish MACD crossover. |
| Moderate | Lower High Structure | Bearish | N/A | The recent peak near $7 failed to reach previous highs, establishing a broader pattern of lower highs on the macro timeframe. |
Frequently Asked Questions about NUAI
What is the current sentiment for NUAI?
The short-term sentiment for NUAI is currently Bearish because Price has sharply broken below both the 20-day and 50-day SMAs on expanding negative MACD momentum. RSI has crossed below 50, indicating sellers are in control short-term.. The long-term trend is classified as Neutral.
What are the key support levels for NUAI?
StockDips.AI has identified key support levels for NUAI at $4.63 and $3.95. These levels may represent potential accumulation zones where buying interest could emerge.
Is NUAI in a significant dip or a Value Dip right now?
NUAI has a Value Score of 62/100. It is not currently flagged as a significant dip in the Top Dips list. It is not listed as a Value Dip because the long-term sentiment or value-score threshold does not qualify.
View the full interactive analysis on StockDips.AI.