BRK.B Daily Technical Analysis
Berkshire Hathaway
A diversified global conglomerate spanning insurance, railroads, energy, and consumer brands.
BRK.B Technical Analysis Summary
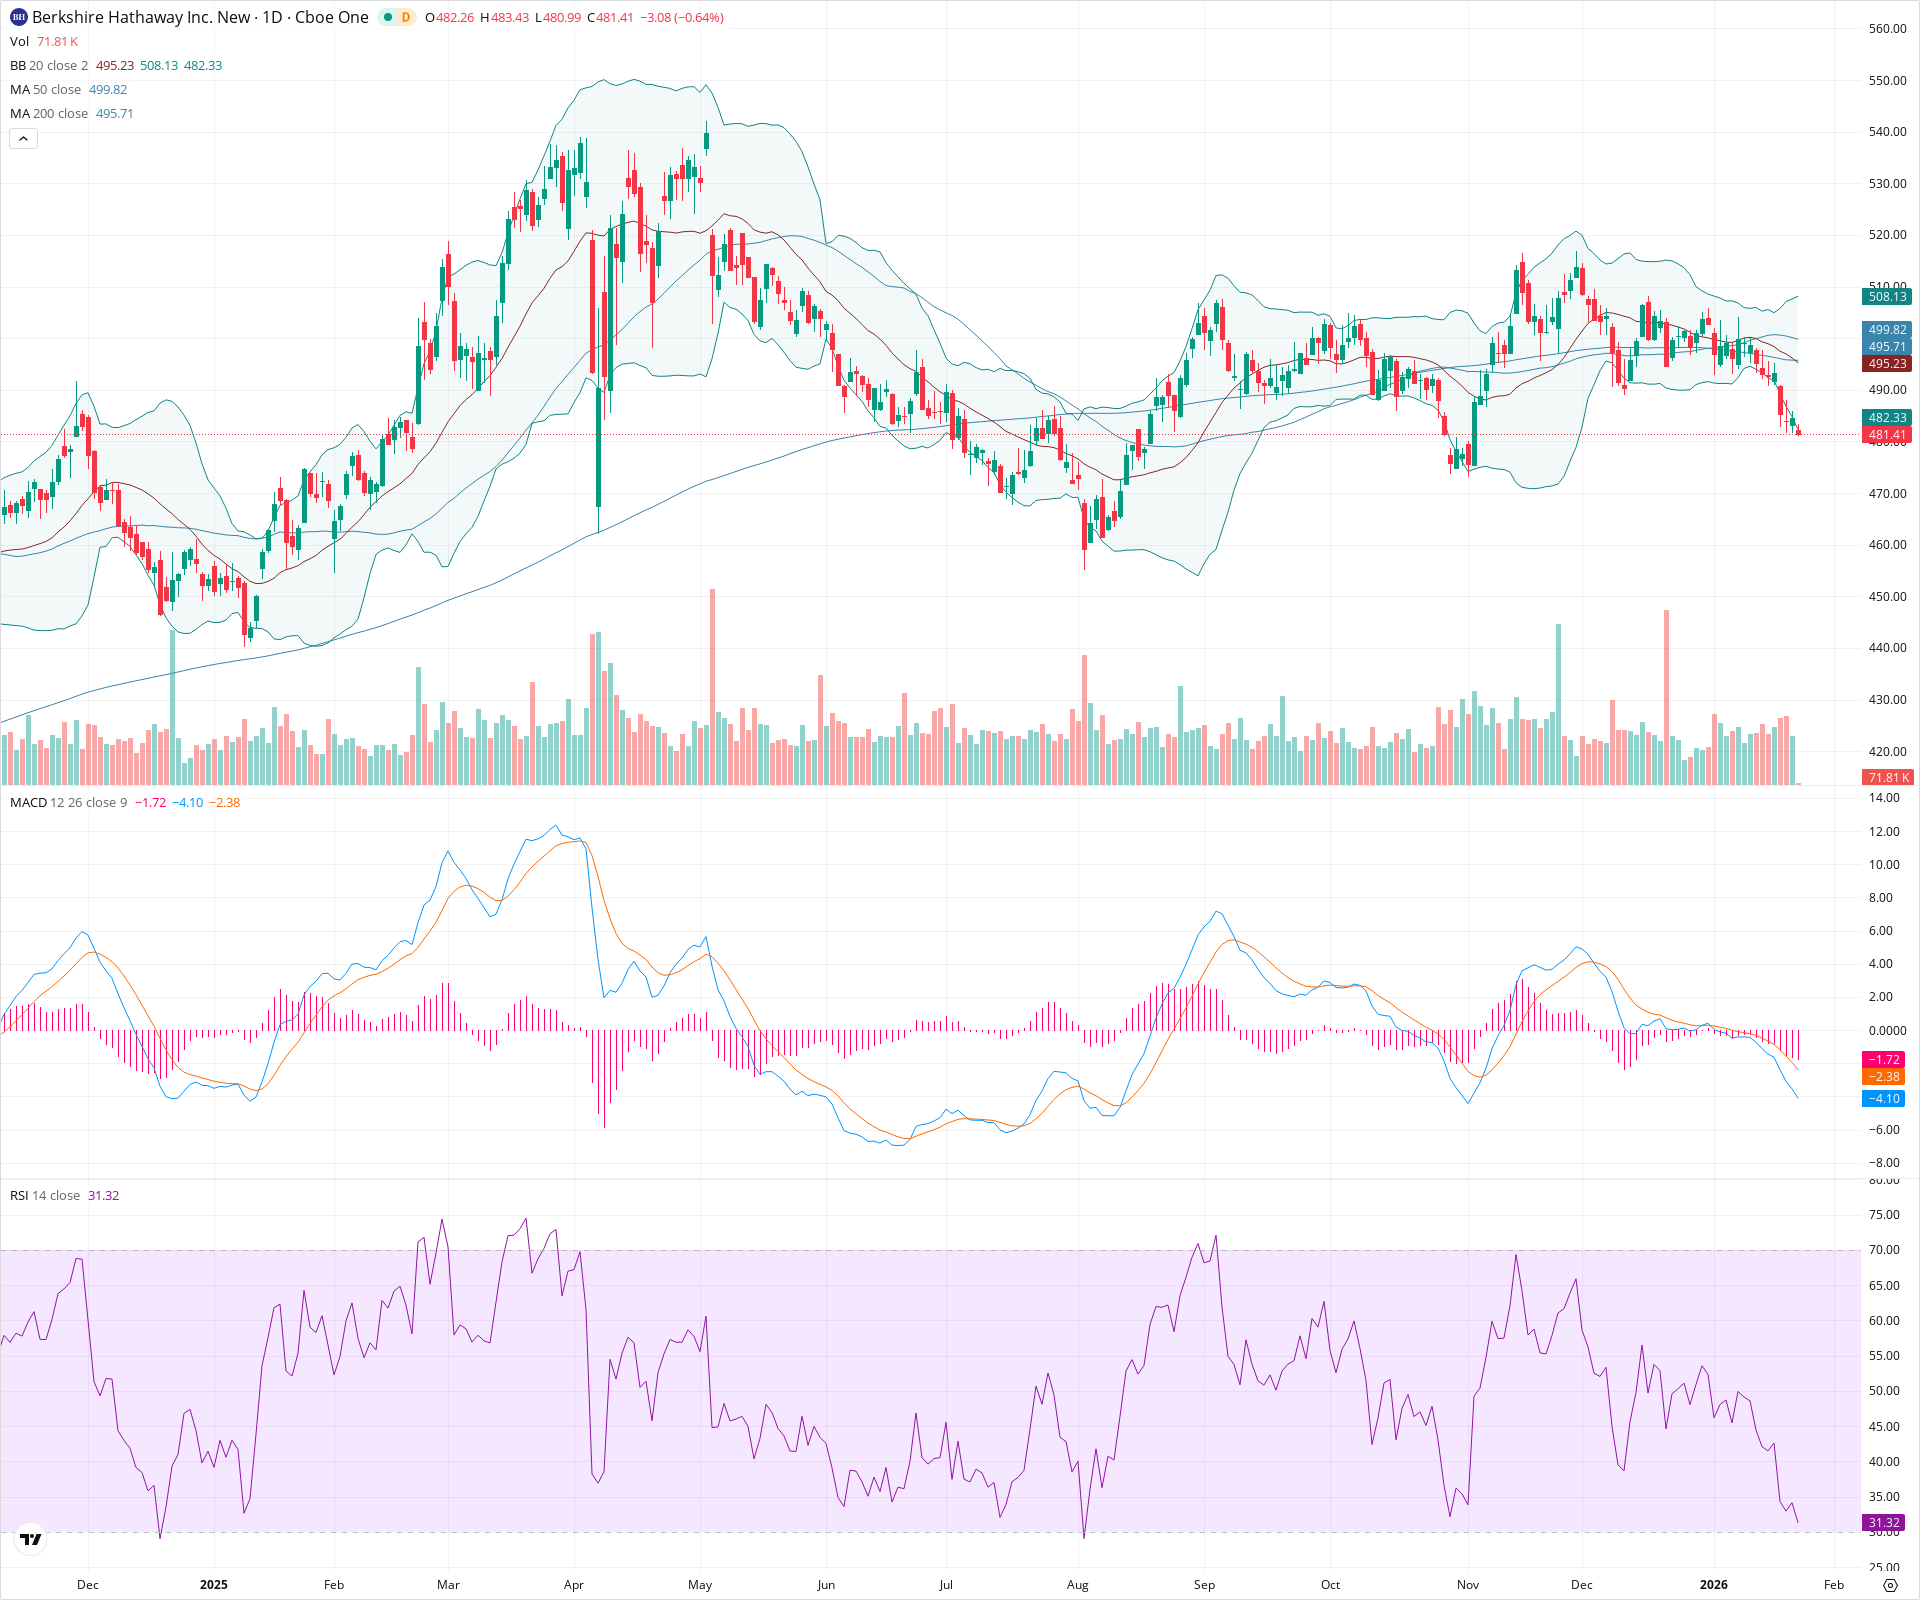
BRK.B has entered a bearish phase after breaking below key structural support at 490 and the long-term 200-day SMA. The breakdown of a potential Head and Shoulders top pattern suggests further downside toward the 455-460 zone, though the RSI nearing 30 may trigger short-term consolidation. Momentum indicators confirm the selling pressure, with no immediate signs of a reversal.
Included In Lists
Related Tickers of Interest
BRK.B Daily Chart
Sentiment
Short-term Sentiment (days to weeks): Bearish
Price has closed below the lower Bollinger Band and the 200-day SMA, indicating strong downward momentum. MACD histogram is expanding negatively, and RSI is plunging toward oversold territory.
Long-term Sentiment (weeks to months): Bearish
The stock has fallen below the critical 200-day SMA (495.71). The 50-day SMA is flattening and converging toward the 200-day, signaling a potential trend reversal from the previous uptrend.
Report Metadata
- Timeframe: daily
- Generated at: 2026-01-23T15:03:32.961Z
- Model: gemini-3-pro-preview
Support Price Levels
| Level | Range | Strength | Notes |
|---|---|---|---|
| $472.50 | $470.00 - $475.00 | Strong | Swing low area from November 2025. |
| $457.50 | $455.00 - $460.00 | Strong | Major swing low support from August 2025. |
Resistance Price Levels
| Level | Range | Strength | Notes |
|---|---|---|---|
| $497.50 | $495.00 - $500.00 | Strong | Confluence of the 200-day SMA, 50-day SMA, and psychological 500 level. |
| $511.50 | $508.00 - $515.00 | Weak | Recent swing highs and upper Bollinger Band area. |
Potential Chart Patterns in Formation
| Strength | Pattern | Signal | Target | Details |
|---|---|---|---|---|
| Strong | Head and Shoulders (Top) | Bearish | $455.00 | A reversal pattern with a head around 515 and shoulders near 505/500. The recent drop below the 485-490 neckline confirms the breakdown. |
| Weak | Bollinger Band Breakdown | Bearish | N/A | Price is closing below the lower Bollinger Band, indicating an expansion of volatility to the downside. |
Frequently Asked Questions about BRK.B
What is the current sentiment for BRK.B?
The short-term sentiment for BRK.B is currently Bearish because Price has closed below the lower Bollinger Band and the 200-day SMA, indicating strong downward momentum. MACD histogram is expanding negatively, and RSI is plunging toward oversold territory.. The long-term trend is classified as Bearish.
What are the key support levels for BRK.B?
StockDips.AI has identified key support levels for BRK.B at $472.50 and $457.50. These levels may represent potential accumulation zones where buying interest could emerge.
Is BRK.B in a significant dip or a Value Dip right now?
BRK.B has a Value Score of 67/100. It is not currently flagged as a significant dip in the Top Dips list. It is not listed as a Value Dip because the long-term sentiment or value-score threshold does not qualify.
View the full interactive analysis on StockDips.AI.