MA Daily Technical Analysis
Mastercard Inc
A global financial services company that provides a wide range of payment choices and processes transactions for credit and debit cards, electronic cash, and ATMs.
MA Technical Analysis Summary
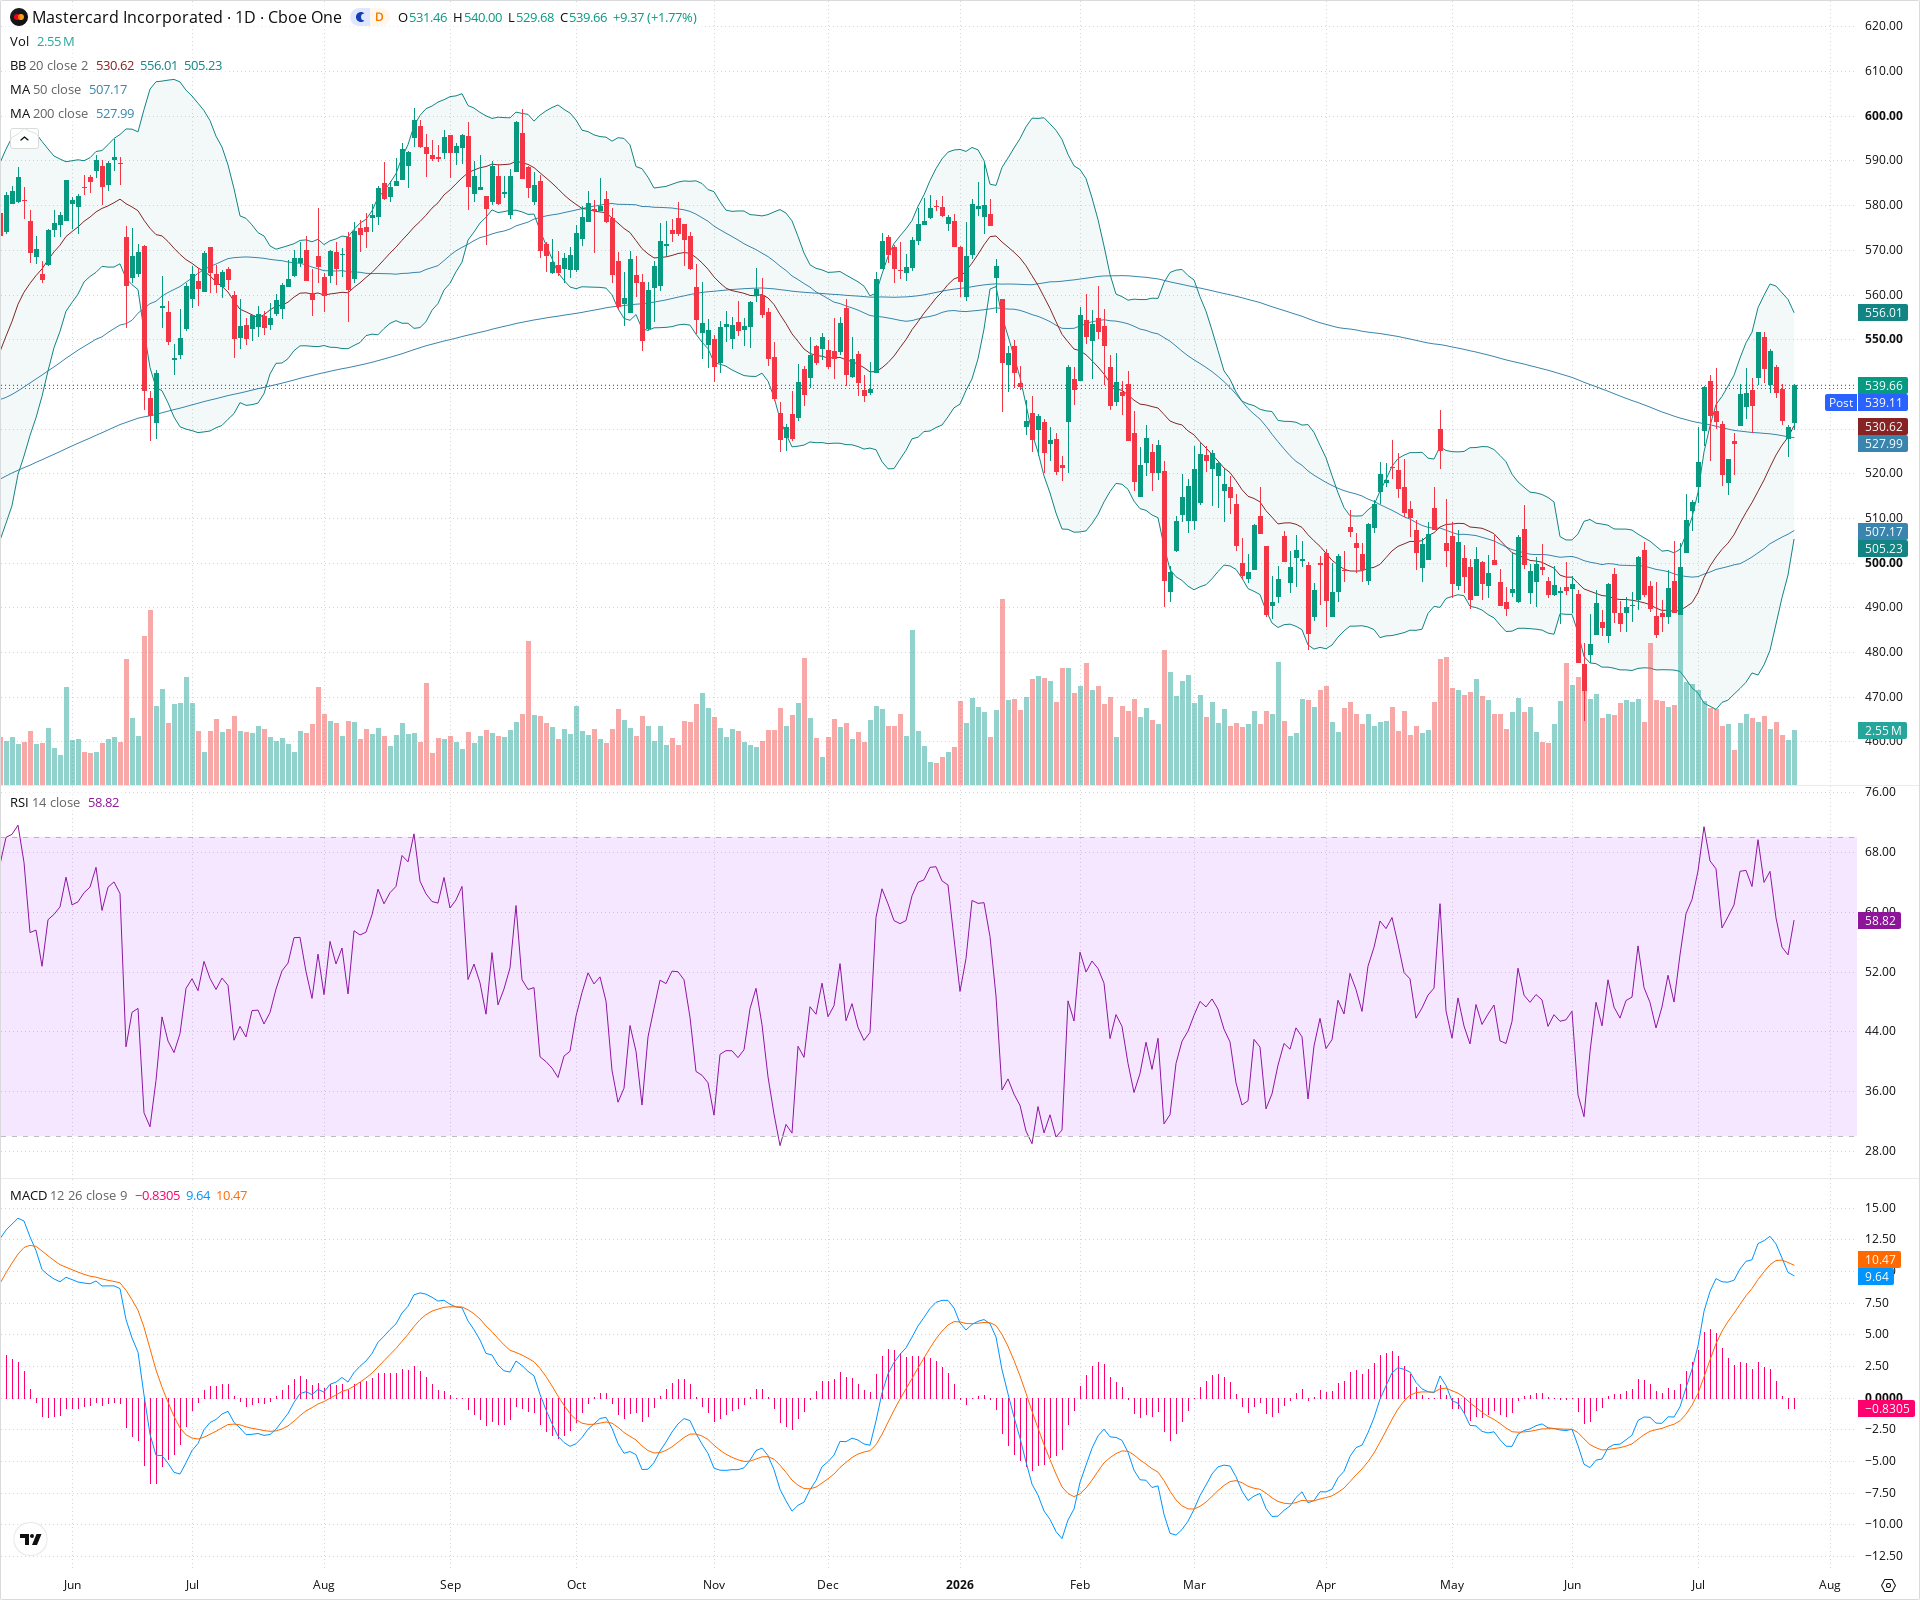
MA has staged a robust recovery from its June lows, successfully reclaiming major moving averages and shifting the long-term structure back to bullish. While short-term momentum indicators like the MACD show a cooling-off period, current price action resembles healthy consolidation. If support holds around the 200-day SMA, the stock is positioned for further upside testing recent swing highs.
Included In Lists
Related Tickers of Interest
MA Daily Chart
Sentiment
Short-term Sentiment (days to weeks): Neutral
Price is currently pulling back from recent highs, with the MACD line crossing below the signal line and a negative histogram indicating waning short-term momentum. However, price remains above the 20-day and 200-day SMAs, suggesting this is a consolidation phase rather than a trend reversal.
Long-term Sentiment (weeks to months): Bullish
The chart shows a significant trend reversal, with price establishing a higher low in June and aggressively breaking back above both the 50-day and 200-day SMAs. The 50-day SMA is curling upwards, indicating a shift in long-term momentum.
Report Metadata
- Timeframe: daily
- Generated at: 2026-07-24T21:14:30.501Z
- Model: gemini-3.1-pro-preview
Support Price Levels
| Level | Range | Strength | Notes |
|---|---|---|---|
| $529.50 | $527.00 - $532.00 | Strong | Confluence of the 200-day SMA (527.99), the 20-day SMA (middle Bollinger Band at 530.62), and recent minor swing lows. |
| $507.50 | $505.00 - $510.00 | Strong | Aligns with the rising 50-day SMA (507.17), the lower Bollinger Band, and a prior consolidation zone. |
| $480.00 | $475.00 - $485.00 | Strong | Major swing low established in June; a critical floor for the long-term structure. |
Resistance Price Levels
| Level | Range | Strength | Notes |
|---|---|---|---|
| $557.50 | $555.00 - $560.00 | Strong | Recent swing highs and near the upper Bollinger Band (556.01). |
| $595.00 | $590.00 - $600.00 | Strong | Major historical resistance zone from highs established earlier in the charted period. |
Potential Chart Patterns in Formation
| Strength | Pattern | Signal | Target | Details |
|---|---|---|---|---|
| Strong | Moving Average Breakout | Bullish | N/A | Price decisively broke and closed above the 200-day SMA, transitioning from long-term resistance to potential support. |
| Weak | Bull Flag (Forming) | Bullish | $590.00 | A sharp upward impulse followed by a shallow, drifting consolidation. If support holds, it suggests continuation of the prior upward move. |
Frequently Asked Questions about MA
What is the current sentiment for MA?
The short-term sentiment for MA is currently Neutral because Price is currently pulling back from recent highs, with the MACD line crossing below the signal line and a negative histogram indicating waning short-term momentum. However, price remains above the 20-day and 200-day SMAs, suggesting this is a consolidation phase rather than a trend reversal.. The long-term trend is classified as Bullish.
What are the key support levels for MA?
StockDips.AI has identified key support levels for MA at $529.50 and $507.50. These levels may represent potential accumulation zones where buying interest could emerge.
Is MA in a significant dip or a Value Dip right now?
MA has a Value Score of 64/100. It is not currently flagged as a significant dip in the Top Dips list. It is not listed as a Value Dip because the long-term sentiment or value-score threshold does not qualify.
View the full interactive analysis on StockDips.AI.