COIN Weekly Technical Analysis
Coinbase Global Inc
Cryptocurrency exchange offering trading, custody, and blockchain services.
COIN Technical Analysis Summary
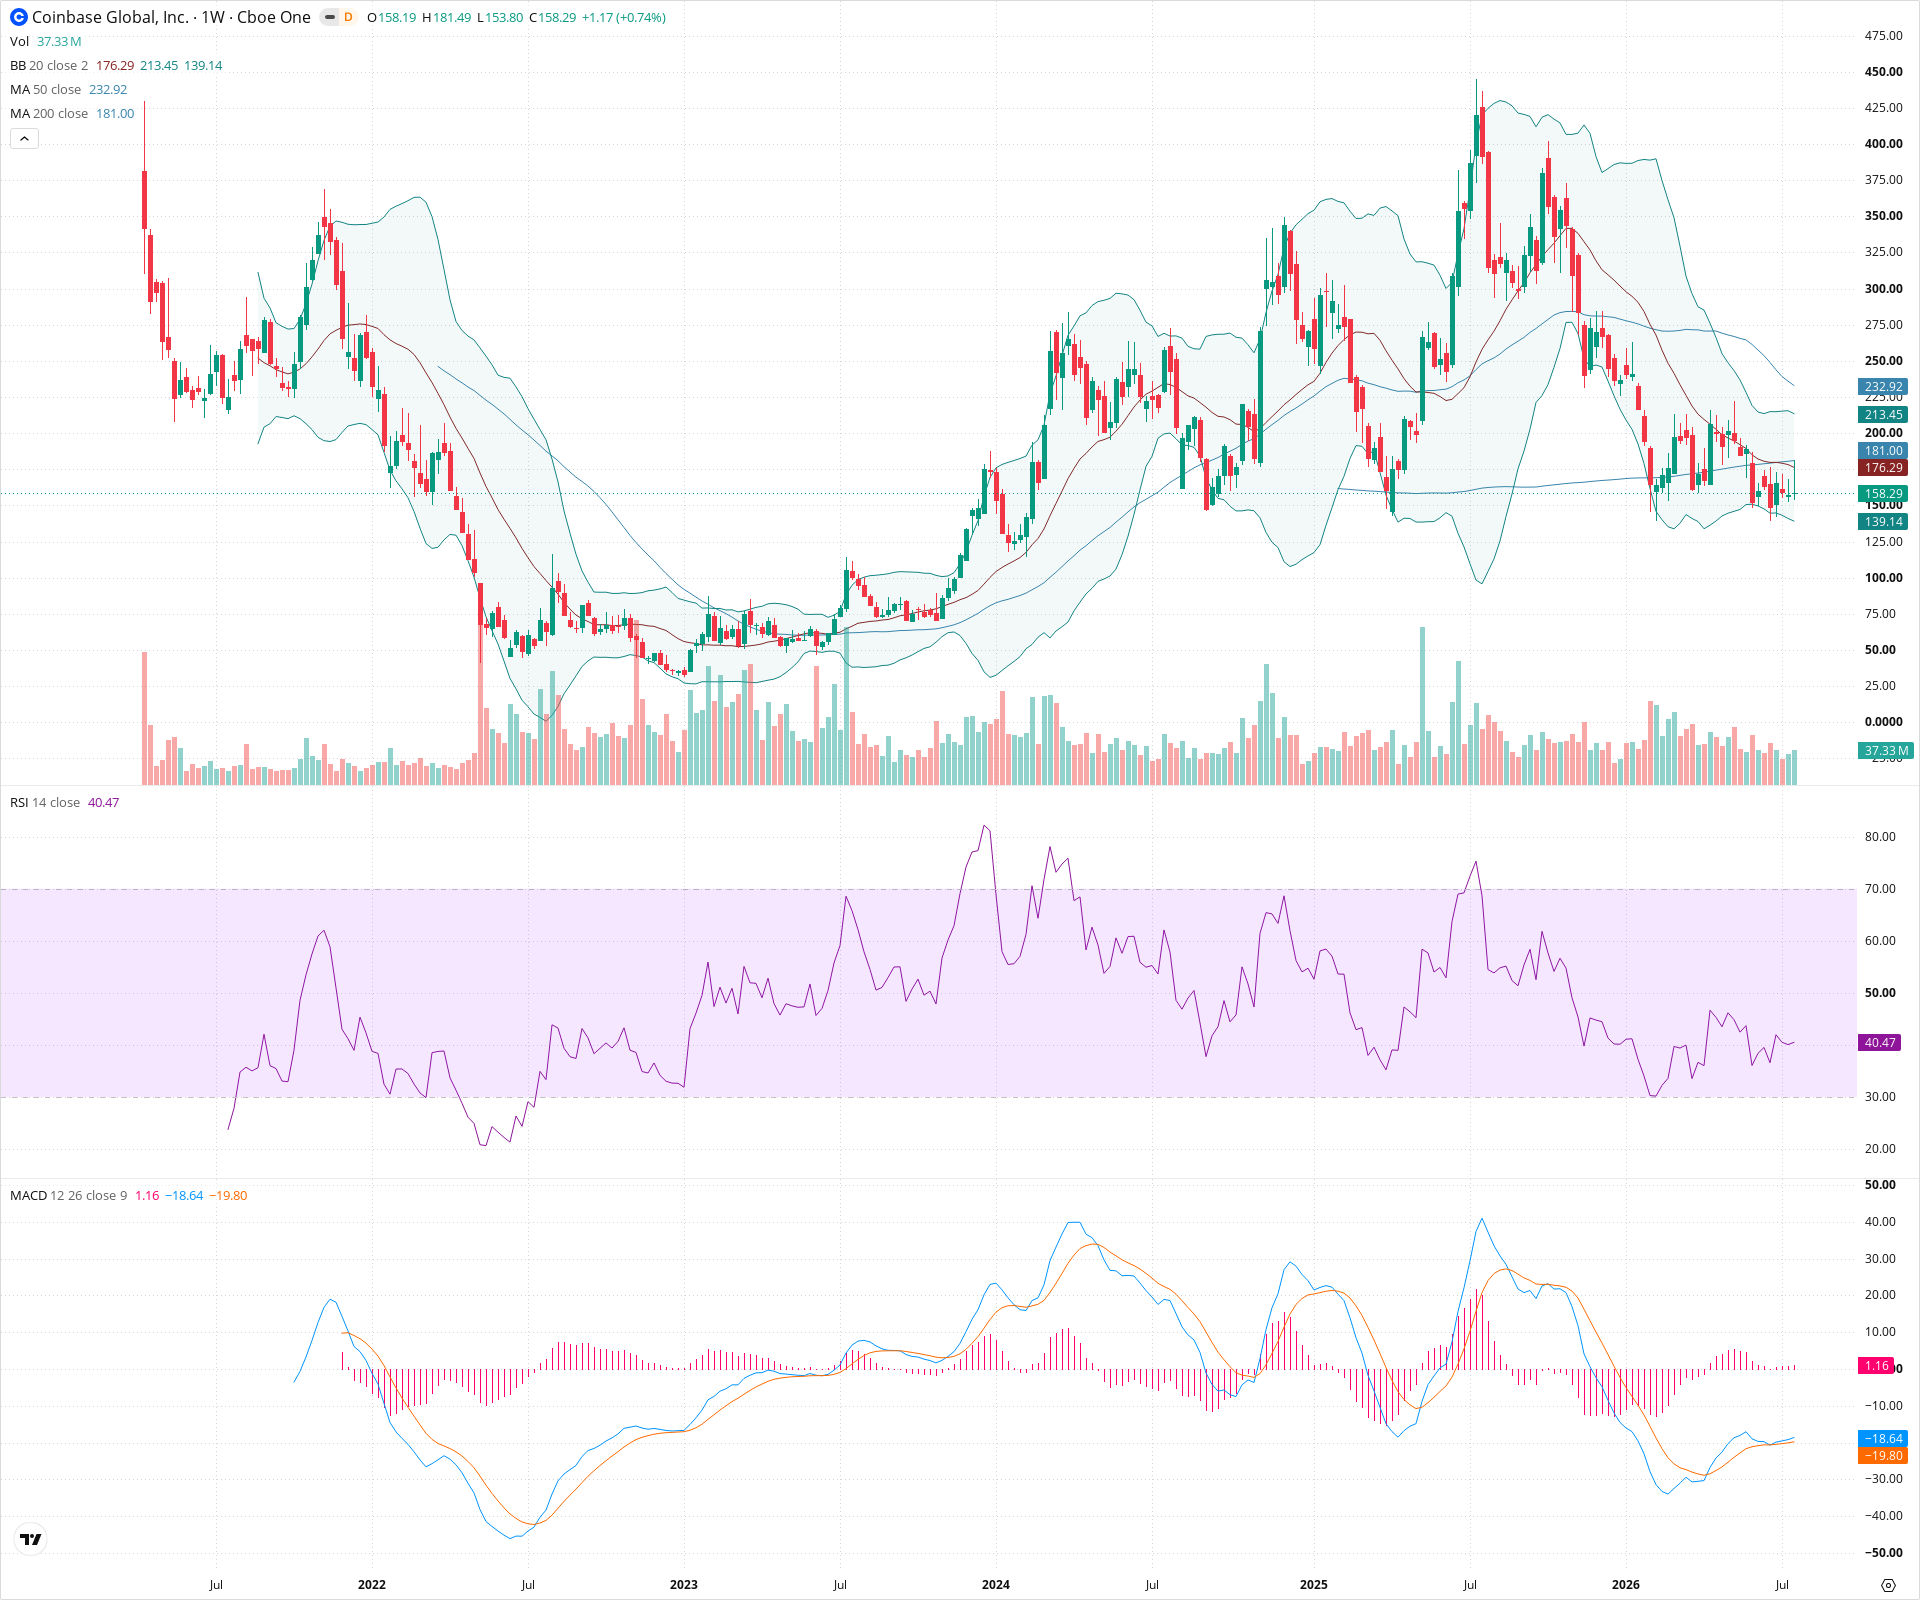
COIN is in a firmly established long-term downtrend on the weekly chart, having broken down from a major top. The stock is currently trading below all key weekly moving averages (20, 50, 200), with momentum indicators confirming the bearish regime. A sustained close above the 200-week SMA (~$181) would be the first necessary step to stabilize the technical picture, while downside risk remains toward the $115-$130 support zone.
Included In Lists
Related Tickers of Interest
COIN Weekly Chart
Sentiment
Short-term Sentiment (days to weeks): Bearish
Price is trading below the 20-week and 200-week SMAs, forming a series of lower highs and lower lows. RSI is at 40, indicating bearish momentum.
Long-term Sentiment (weeks to months): Bearish
The long-term structure shows a breakdown from a major topping pattern. Price is decisively below a sharply downward-sloping 50-week SMA, and MACD remains deep in negative territory.
Report Metadata
- Timeframe: weekly
- Generated at: 2026-07-25T09:13:48.999Z
- Model: gemini-3.1-pro-preview
Support Price Levels
| Level | Range | Strength | Notes |
|---|---|---|---|
| $122.50 | $115.00 - $130.00 | Strong | Recent swing low and prior structural consolidation zone from mid-2023. |
| $80.00 | $75.00 - $85.00 | Strong | Major prior resistance turned support; top of the extensive basing pattern formed throughout 2022 and early 2023. |
Resistance Price Levels
| Level | Range | Strength | Notes |
|---|---|---|---|
| $180.00 | $175.00 - $185.00 | Strong | Confluence of the 20-week SMA (mid-Bollinger Band) and the flat 200-week SMA. |
| $217.50 | $200.00 - $235.00 | Strong | Major structural breakdown zone and the current location of the downward-sloping 50-week SMA. |
Potential Chart Patterns in Formation
| Strength | Pattern | Signal | Target | Details |
|---|---|---|---|---|
| Strong | Downtrend / Descending Channel | Bearish | N/A | Since the peak near $280, the price has established a clear pattern of lower highs and lower lows on the weekly timeframe. |
Frequently Asked Questions about COIN
What is the current sentiment for COIN?
The short-term sentiment for COIN is currently Bearish because Price is trading below the 20-week and 200-week SMAs, forming a series of lower highs and lower lows. RSI is at 40, indicating bearish momentum.. The long-term trend is classified as Bearish.
What are the key support levels for COIN?
StockDips.AI has identified key support levels for COIN at $122.50 and $80.00. These levels may represent potential accumulation zones where buying interest could emerge.
Is COIN in a significant dip or a Value Dip right now?
COIN has a Value Score of 47/100. It is not currently flagged as a significant dip in the Top Dips list. It is not listed as a Value Dip because the long-term sentiment or value-score threshold does not qualify.
View the full interactive analysis on StockDips.AI.