XYZ Daily Technical Analysis
Block, Inc
Block operates an ecosystem of financial products and services: Square, Cash App, Afterpay
XYZ Technical Analysis Summary
The technical picture for the asset remains fundamentally bullish over the long term, supported by rising 50-day and 200-day moving averages and a clear structure of higher highs. However, in the short term, the asset is experiencing a pullback characterized by bearish MACD momentum and a drop below the 20-day SMA. Investors should watch the 50-day SMA around the $74 level as a key area where long-term support may step in to resume the primary uptrend.
Included In Lists
Related Tickers of Interest
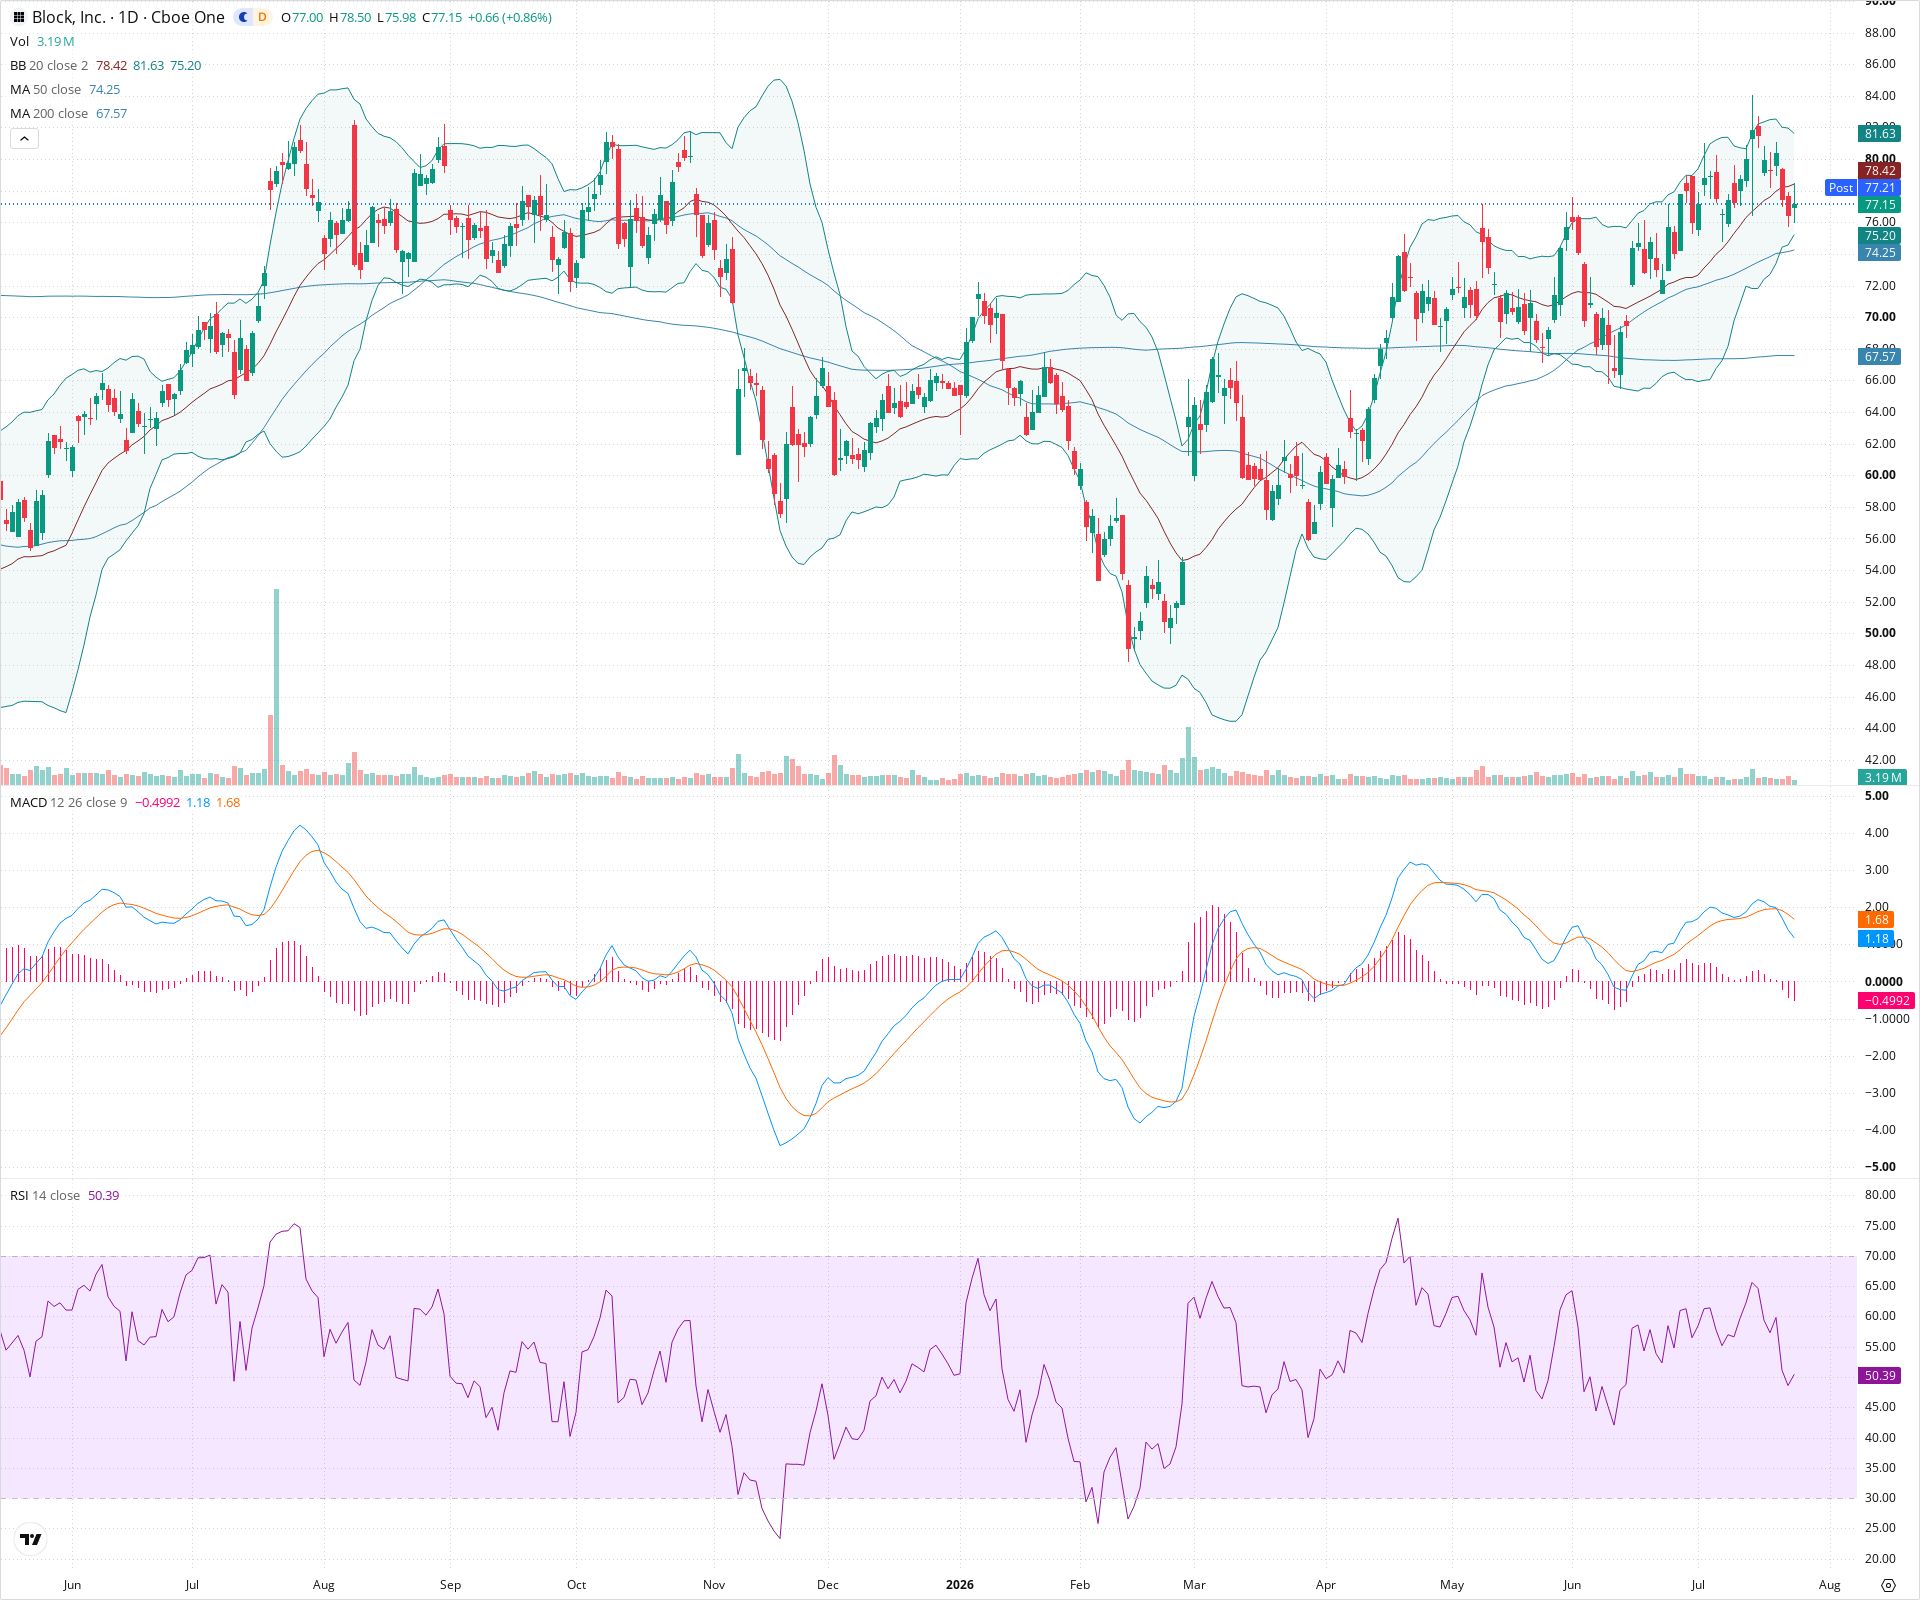
XYZ Daily Chart
Sentiment
Short-term Sentiment (days to weeks): Bearish
Price has recently fallen below the 20-day SMA, accompanied by a bearish MACD crossover and a declining RSI heading towards the midline, indicating short-term downward momentum.
Long-term Sentiment (weeks to months): Bullish
The broader market structure shows a clear series of higher highs and higher lows. The price remains comfortably above both the 50-day and 200-day SMAs, which are sloping upwards, indicating a healthy long-term uptrend.
Report Metadata
- Timeframe: daily
- Generated at: 2026-07-24T21:08:05.601Z
- Model: gemini-3.1-pro-preview
Support Price Levels
| Level | Range | Strength | Notes |
|---|---|---|---|
| $73.25 | $72.00 - $74.50 | Strong | Zone encompassing the rising 50-day SMA (74.25) and a previous consolidation area that should act as strong structural support. |
| $66.00 | $64.00 - $68.00 | Strong | Major structural support zone aligning with the 200-day SMA (67.57) and significant previous swing lows. |
Resistance Price Levels
| Level | Range | Strength | Notes |
|---|---|---|---|
| $78.50 | $78.00 - $79.00 | Weak | Immediate resistance at the 20-day SMA (middle Bollinger Band), which price recently broke below. |
| $83.00 | $82.00 - $84.00 | Strong | Recent swing high and significant supply zone where the prior rally was halted. |
Potential Chart Patterns in Formation
| Strength | Pattern | Signal | Target | Details |
|---|---|---|---|---|
| Strong | Uptrend Channel | Bullish | N/A | A sustained sequence of higher highs and higher lows visible over the past several months, supported by rising moving averages. |
| Weak | Bullish Pullback | Bullish | $84.00 | Current downward price action appears to be a standard pullback within the larger uptrend, likely seeking support near the 50-day SMA to form a higher low. |
Frequently Asked Questions about XYZ
What is the current sentiment for XYZ?
The short-term sentiment for XYZ is currently Bearish because Price has recently fallen below the 20-day SMA, accompanied by a bearish MACD crossover and a declining RSI heading towards the midline, indicating short-term downward momentum.. The long-term trend is classified as Bullish.
What are the key support levels for XYZ?
StockDips.AI has identified key support levels for XYZ at $73.25 and $66.00. These levels may represent potential accumulation zones where buying interest could emerge.
Is XYZ in a significant dip or a Value Dip right now?
XYZ has a Value Score of 26/100. It is not currently flagged as a significant dip in the Top Dips list. It is not listed as a Value Dip because the long-term sentiment or value-score threshold does not qualify.
View the full interactive analysis on StockDips.AI.