BKKT Daily Technical Analysis
Bakkt Holdings, Inc
A financial technology company that operates a digital asset platform.
BKKT Technical Analysis Summary
BKKT remains trapped in a severe long-term downtrend, trading well below its 200-day moving average. For the past several months, the stock has been consolidating in a tight horizontal channel, struggling to gain any bullish momentum. Oscillators like MACD and RSI suggest continued weakness; a decisive breakout above the 50-day SMA is required to shift the near-term narrative, while a loss of the $6.50 support could signal further downside price discovery.
Included In Lists
Related Tickers of Interest
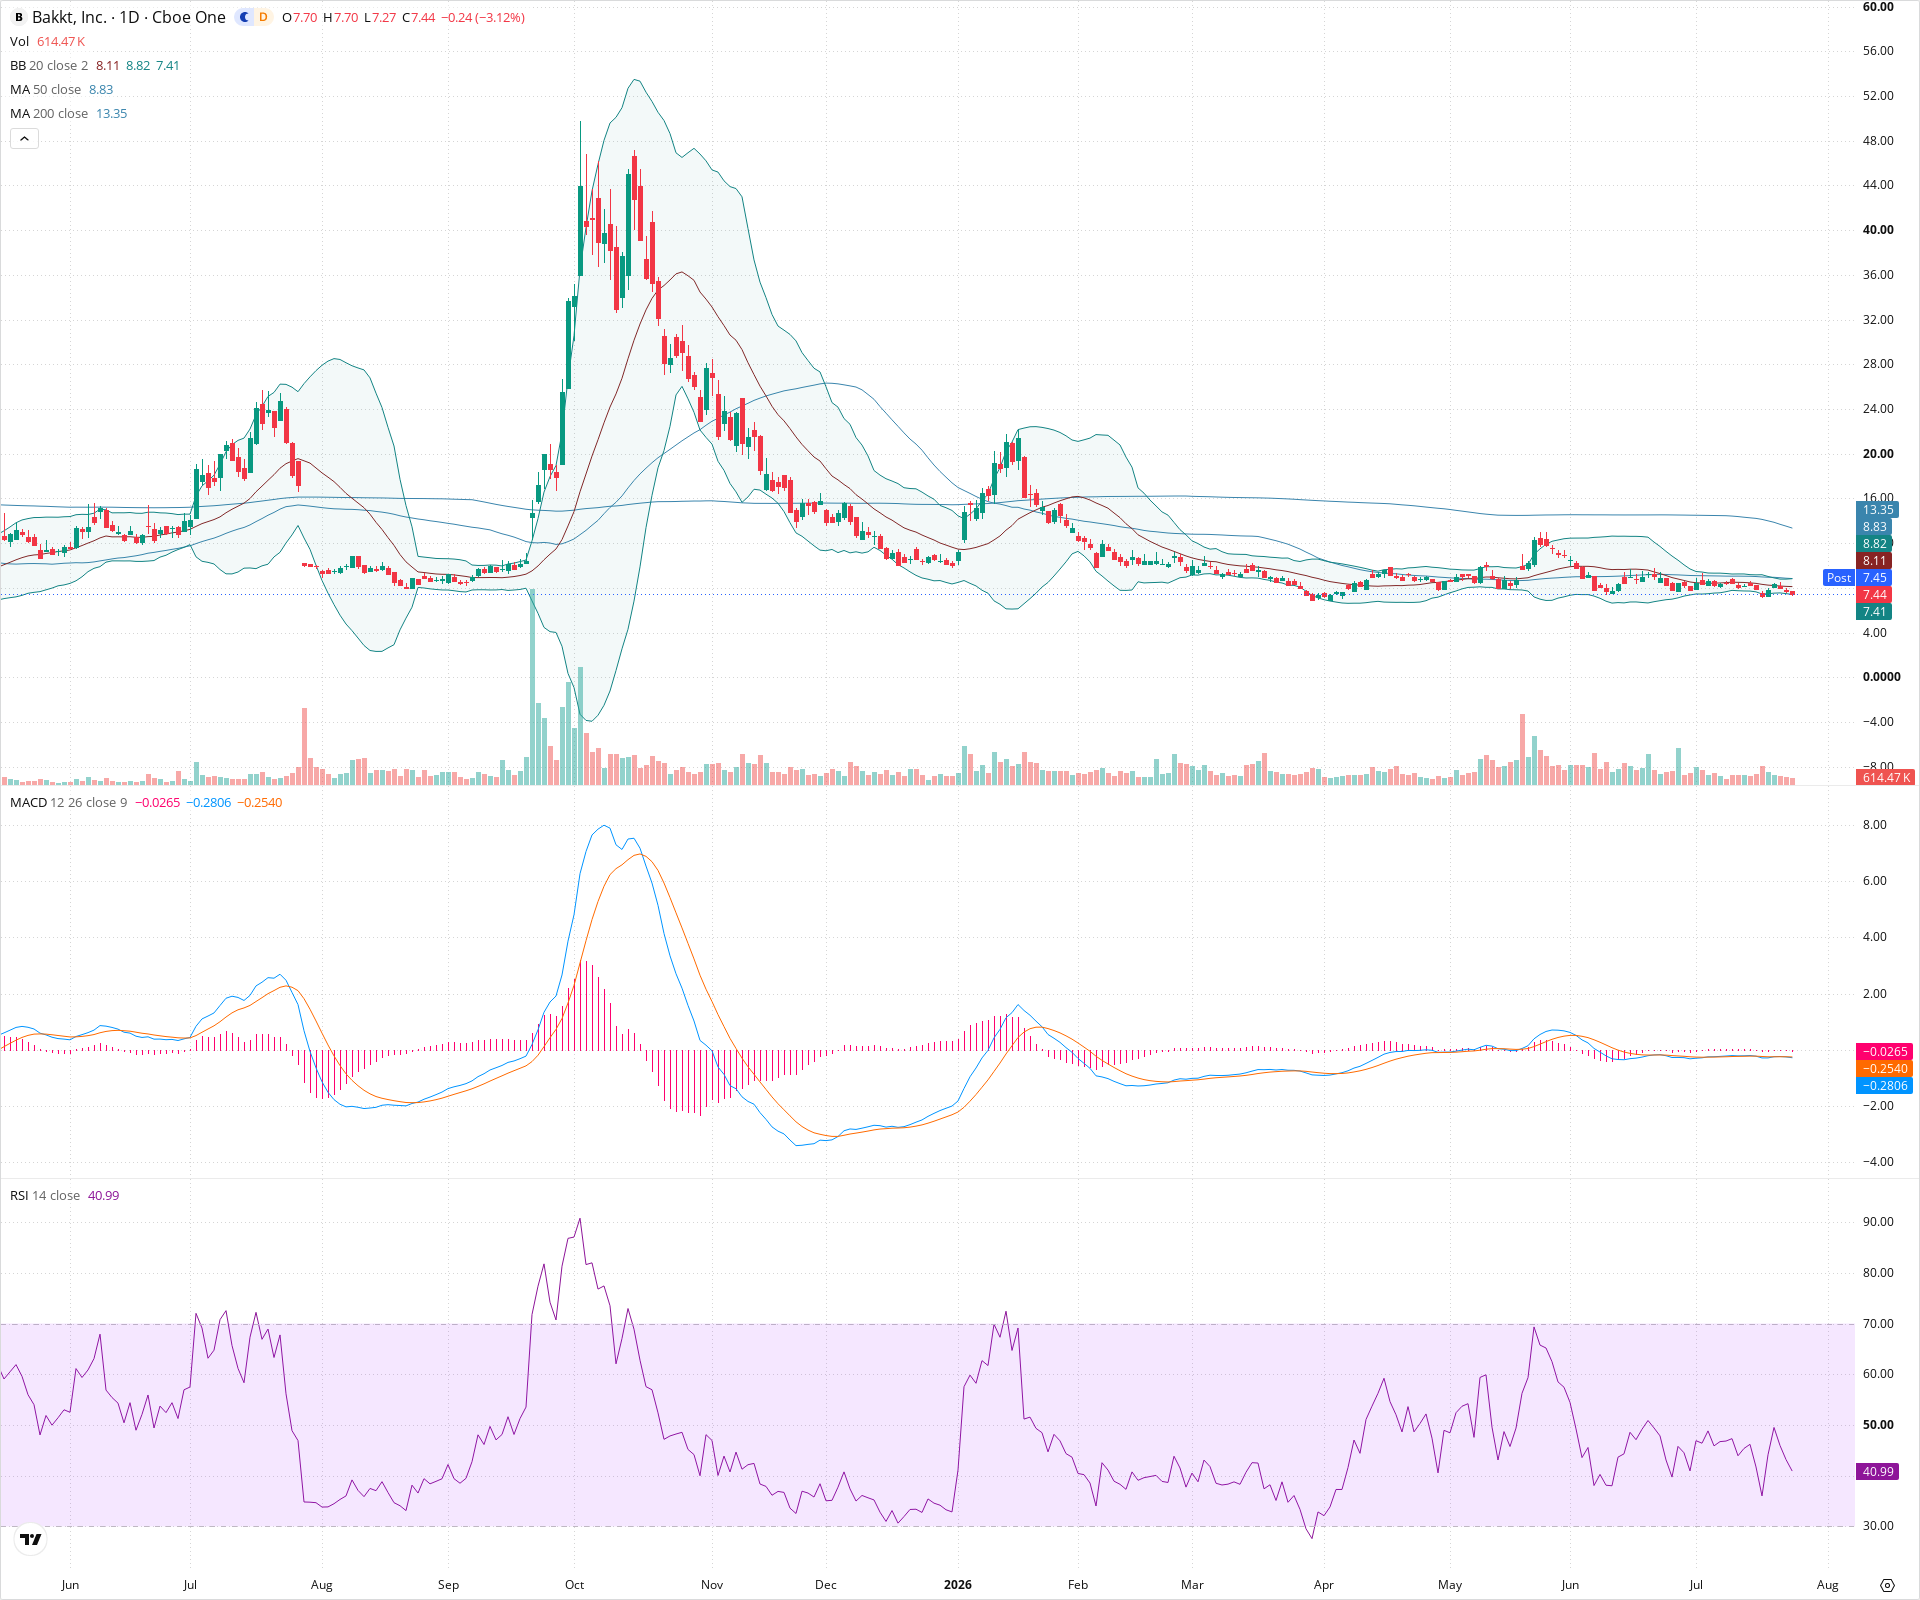
BKKT Daily Chart
Sentiment
Short-term Sentiment (days to weeks): Bearish
Price is drifting toward the lower end of its consolidation range, trading below both the 20-day and 50-day SMAs. RSI is hovering near 41, and MACD shows a recent bearish crossover with negative histogram bars, indicating weak short-term momentum.
Long-term Sentiment (weeks to months): Bearish
The stock remains in a protracted structural downtrend, trading significantly below a declining 200-day moving average, unable to sustain any meaningful rallies since its historical peak.
Report Metadata
- Timeframe: daily
- Generated at: 2026-07-24T21:05:04.006Z
- Model: gemini-3.1-pro-preview
Support Price Levels
| Level | Range | Strength | Notes |
|---|---|---|---|
| $6.75 | $6.50 - $7.00 | Strong | Recent multi-month consolidation floor and swing low zone that has repeatedly held up price action. |
| $6.15 | $6.00 - $6.30 | Weak | Secondary support area based on deeper wicks observed earlier in the year. |
Resistance Price Levels
| Level | Range | Strength | Notes |
|---|---|---|---|
| $8.75 | $8.50 - $9.00 | Strong | Immediate overhead resistance zone encompassing recent range highs and the declining 50-day SMA. |
| $13.50 | $13.00 - $14.00 | Strong | Major structural resistance zone aligned with the 200-day SMA and historical support-turned-resistance levels. |
Potential Chart Patterns in Formation
| Strength | Pattern | Signal | Target | Details |
|---|---|---|---|---|
| Strong | Horizontal Channel | Neutral | N/A | Price has been trapped in a sideways trading range between roughly $6.50 support and $9.00 resistance for several months, indicating a pause in the long-term downtrend. |
Frequently Asked Questions about BKKT
What is the current sentiment for BKKT?
The short-term sentiment for BKKT is currently Bearish because Price is drifting toward the lower end of its consolidation range, trading below both the 20-day and 50-day SMAs. RSI is hovering near 41, and MACD shows a recent bearish crossover with negative histogram bars, indicating weak short-term momentum.. The long-term trend is classified as Bearish.
What are the key support levels for BKKT?
StockDips.AI has identified key support levels for BKKT at $6.75 and $6.15. These levels may represent potential accumulation zones where buying interest could emerge.
Is BKKT in a significant dip or a Value Dip right now?
BKKT has a Value Score of 66/100. It is not currently flagged as a significant dip in the Top Dips list. It is not listed as a Value Dip because the long-term sentiment or value-score threshold does not qualify.
View the full interactive analysis on StockDips.AI.