HOOD Weekly Technical Analysis
Robinhood Markets Inc
Retail brokerage app offering commission-free stock, options, and crypto trading.
HOOD Technical Analysis Summary
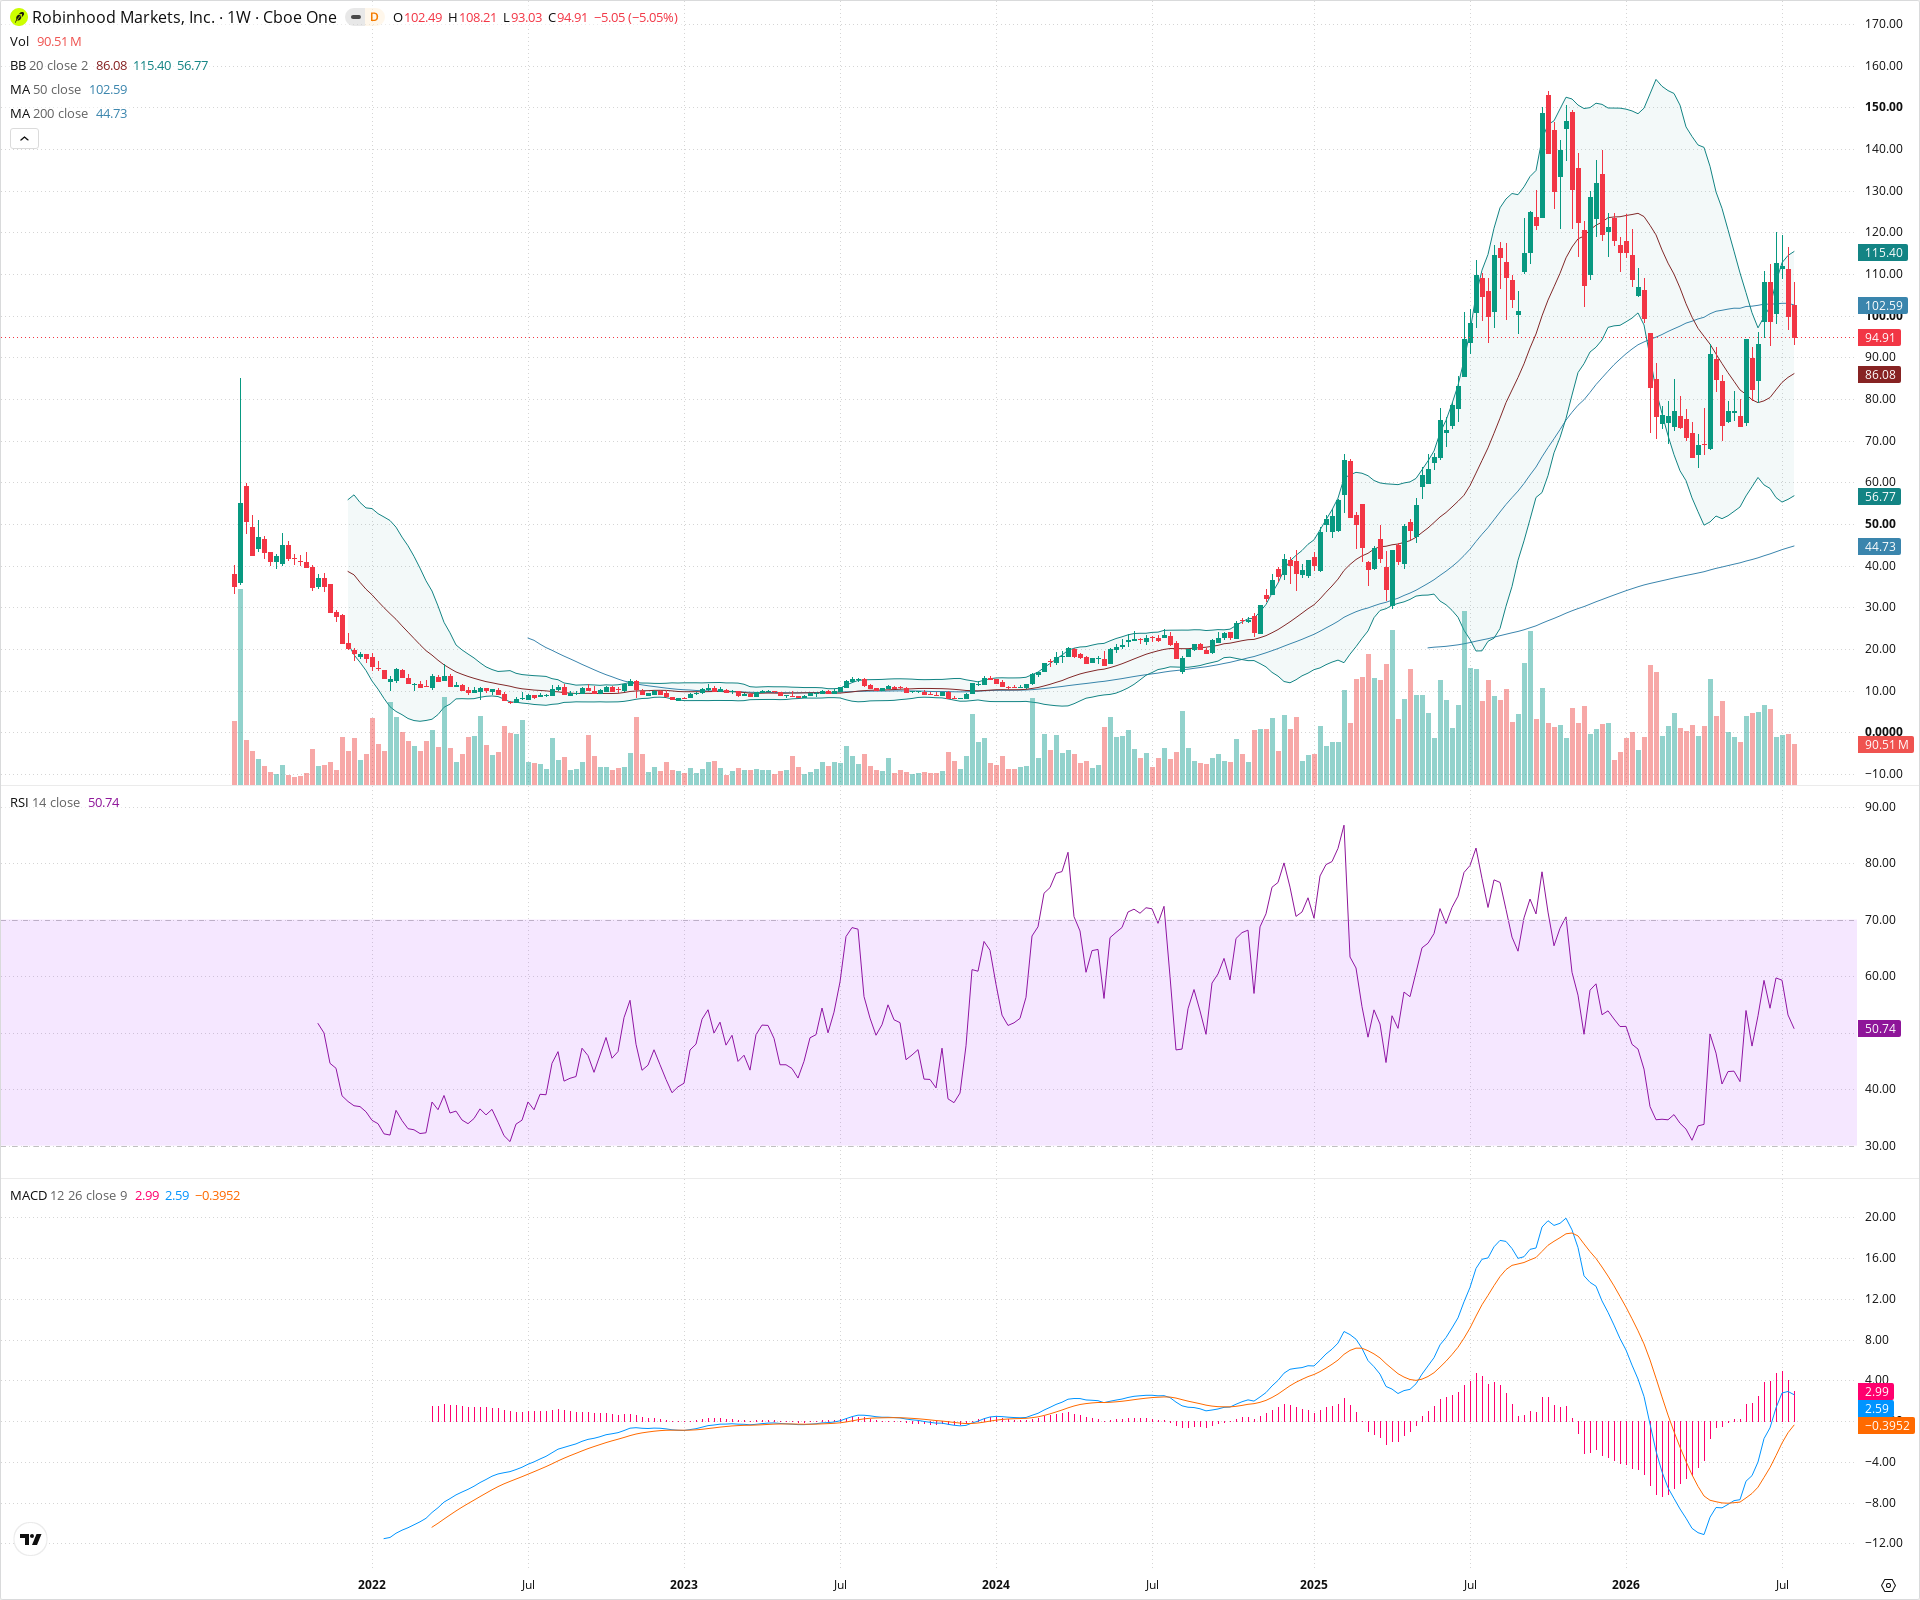
HOOD has experienced a massive multi-month rally, followed by an aggressive correction in recent weeks. The short-term momentum is decidedly bearish as price slices through the 50-week SMA and MACD accelerates downwards. However, the macro trend remains bullish as long as major lower support zones and the rising 200-week SMA are defended. Long-term investors should watch for stabilization near the 75-80 zone.
Included In Lists
Related Tickers of Interest
HOOD Weekly Chart
Sentiment
Short-term Sentiment (days to weeks): Bearish
Price is currently in a sharp multi-week pullback from recent highs, recently closing below the 50-week SMA. The MACD histogram has turned sharply negative and the RSI is pointing downward near the midline, indicating downward momentum.
Long-term Sentiment (weeks to months): Bullish
Despite the current sharp pullback, the broader long-term trend remains upward, with higher highs and higher lows established over the past year. The 200-week SMA is sloping upwards and price remains significantly above it.
Report Metadata
- Timeframe: weekly
- Generated at: 2026-07-25T09:13:15.798Z
- Model: gemini-3.1-pro-preview
Support Price Levels
| Level | Range | Strength | Notes |
|---|---|---|---|
| $77.50 | $75.00 - $80.00 | Strong | Previous major consolidation zone and swing low before the most recent leg up. Aligning closely with the long-term upward trendline. |
| $62.50 | $60.00 - $65.00 | Strong | Major structural support zone from earlier in the uptrend, also roughly confluent with the current location of the 200-week SMA. |
Resistance Price Levels
| Level | Range | Strength | Notes |
|---|---|---|---|
| $117.50 | $115.00 - $120.00 | Strong | Recent swing high resistance area before the current sell-off, also roughly where the 20-week SMA is currently positioned. |
| $155.00 | $150.00 - $160.00 | Strong | The all-time high area established during the massive run-up; represents major psychological and structural resistance. |
Potential Chart Patterns in Formation
| Strength | Pattern | Signal | Target | Details |
|---|---|---|---|---|
| Strong | Sharp Pullback / Correction | Bearish | N/A | The price is experiencing a significant vertical drop following a parabolic run, breaking short-term moving averages. |
Frequently Asked Questions about HOOD
What is the current sentiment for HOOD?
The short-term sentiment for HOOD is currently Bearish because Price is currently in a sharp multi-week pullback from recent highs, recently closing below the 50-week SMA. The MACD histogram has turned sharply negative and the RSI is pointing downward near the midline, indicating downward momentum.. The long-term trend is classified as Bullish.
What are the key support levels for HOOD?
StockDips.AI has identified key support levels for HOOD at $77.50 and $62.50. These levels may represent potential accumulation zones where buying interest could emerge.
Is HOOD in a significant dip or a Value Dip right now?
HOOD has a Value Score of 83/100. It is currently flagged as a significant dip in the Top Dips list. It is also listed as a Value Dip because long-term sentiment is bullish.
View the full interactive analysis on StockDips.AI.