IBRX Daily Technical Analysis
Immunitybio Inc
Commercial-stage biotechnology company that develops next-generation therapies designed to bolster the natural immune system to defeat cancers and infectious diseases.
IBRX Technical Analysis Summary
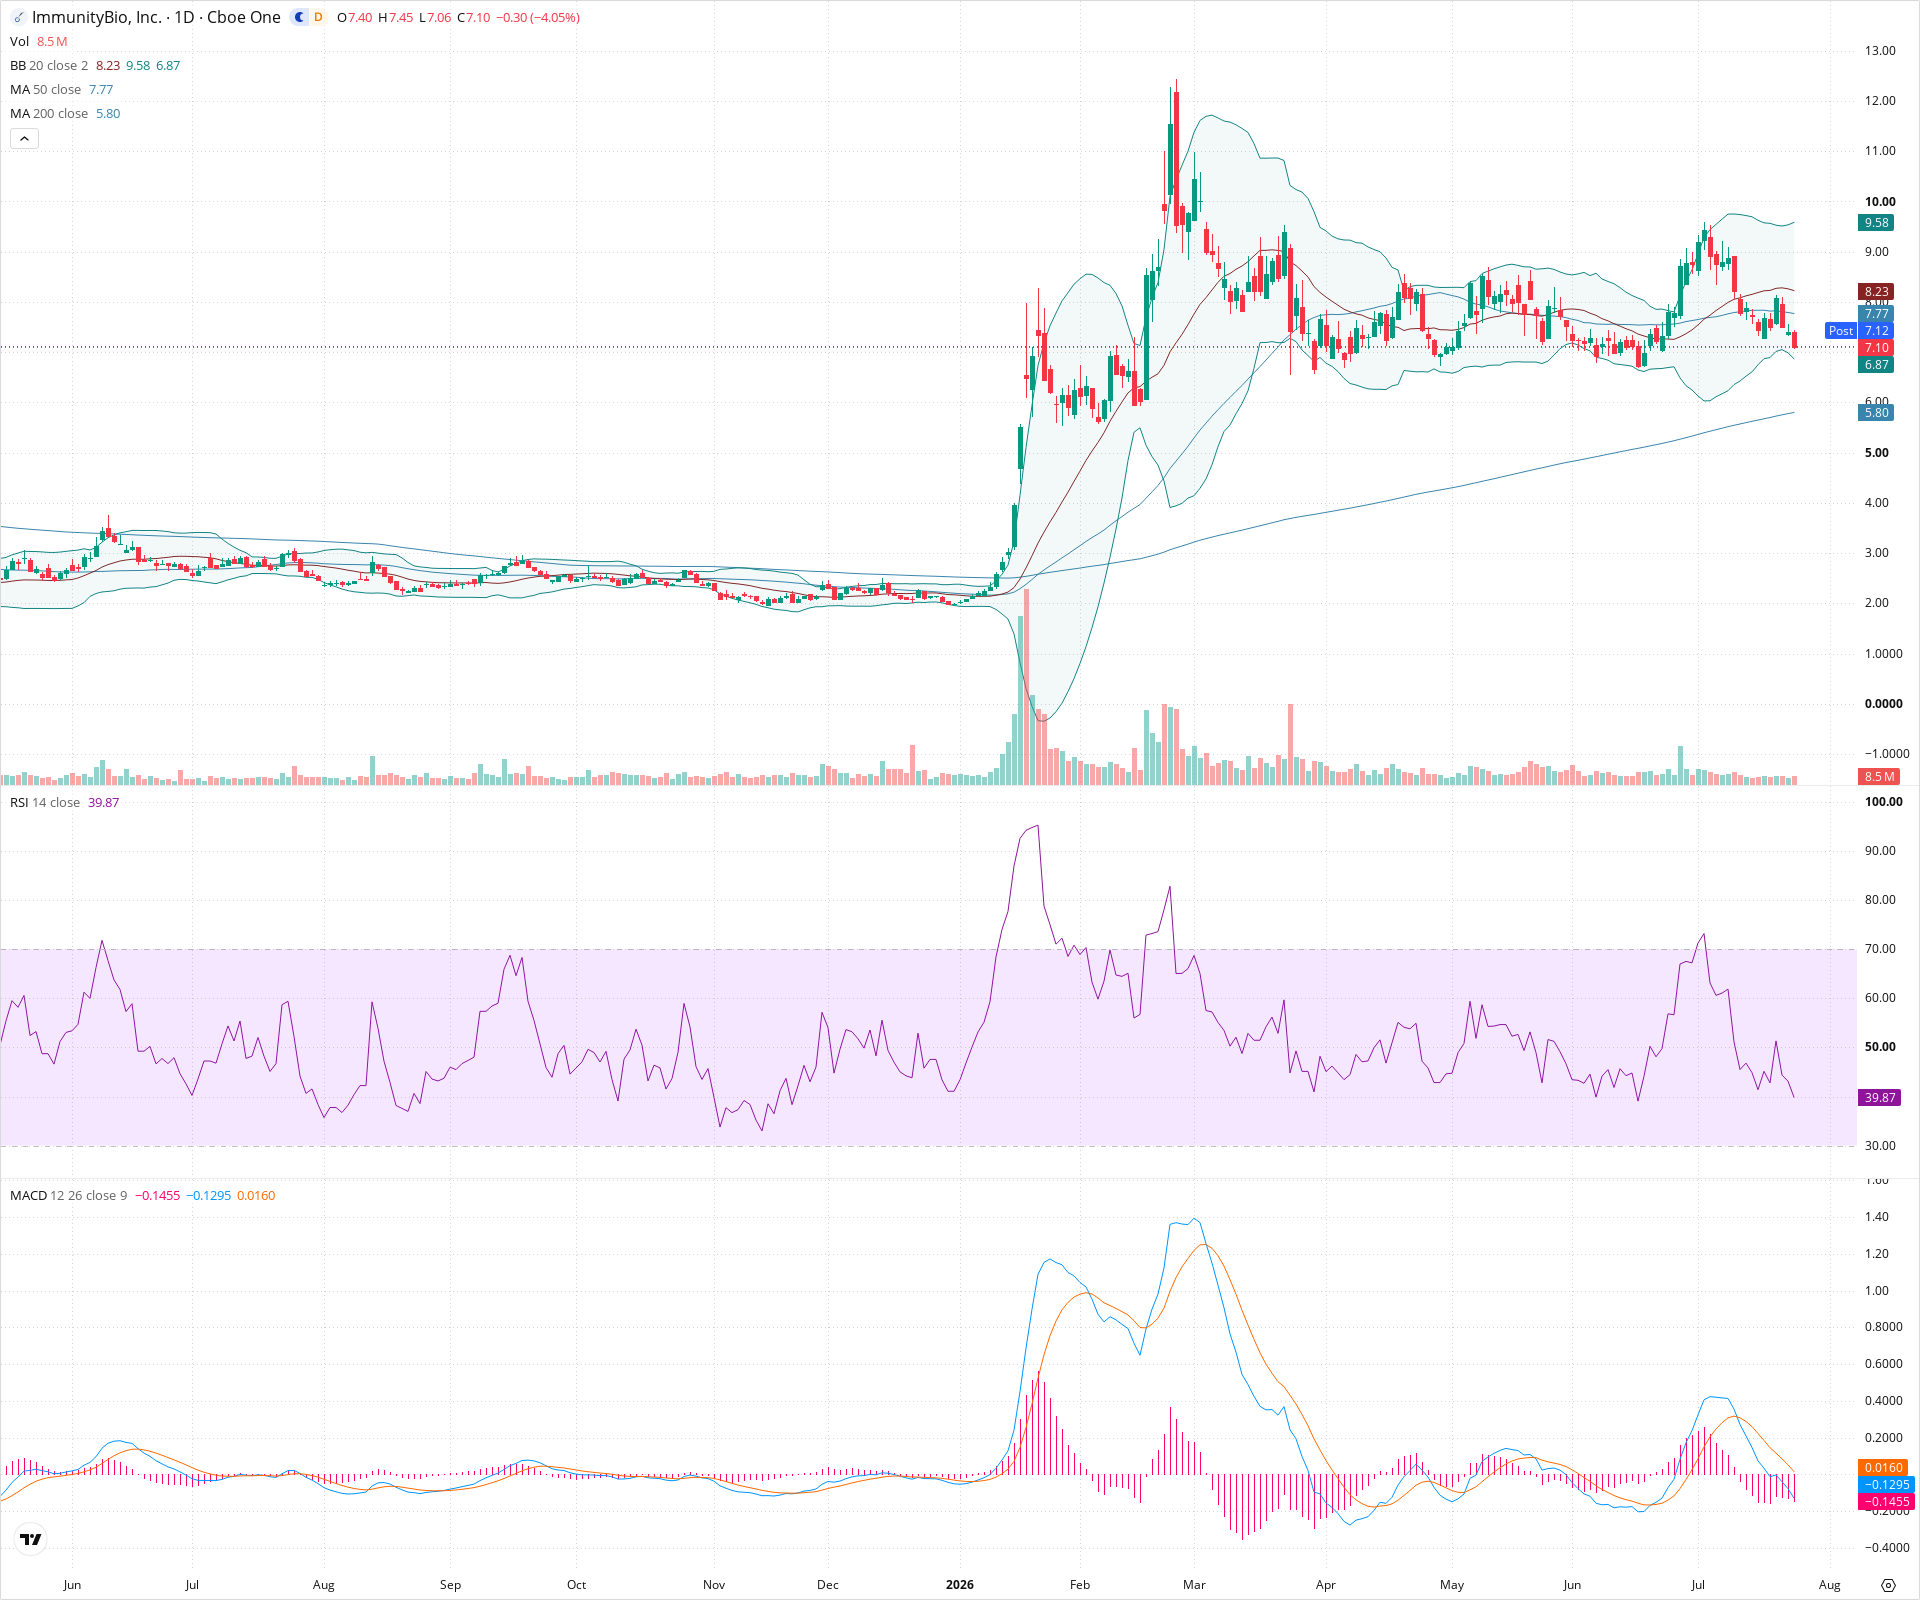
IBRX is experiencing a short-term pullback within a longer-term uptrend. The price has recently fallen below its 50-day moving average, and momentum indicators like RSI and MACD are currently bearish. However, the longer-term bullish structure remains intact as long as the price stays above the rising 200-day MA. Investors should monitor the immediate support around 6.80 - 7.00 for potential stabilization.
Included In Lists
Related Tickers of Interest
IBRX Daily Chart
Sentiment
Short-term Sentiment (days to weeks): Bearish
Price is in a short-term downtrend, closing below the 50-day moving average. MACD line is below the signal line and below zero, with a negative histogram. RSI is around 40 and pointing down, indicating bearish momentum.
Long-term Sentiment (weeks to months): Bullish
The long-term trend remains positive as the 50-day MA is above the 200-day MA (golden cross intact), and the price is currently well above the rising 200-day MA.
Report Metadata
- Timeframe: daily
- Generated at: 2026-07-24T21:14:35.499Z
- Model: gemini-3.1-pro-preview
Support Price Levels
| Level | Range | Strength | Notes |
|---|---|---|---|
| $6.90 | $6.80 - $7.00 | Strong | Recent consolidation area and lower Bollinger Band. |
| $5.85 | $5.70 - $6.00 | Strong | Previous major support zone from earlier in the year and current location of the 200-day MA. |
Resistance Price Levels
| Level | Range | Strength | Notes |
|---|---|---|---|
| $7.95 | $7.70 - $8.20 | Strong | Zone encompassing the 50-day MA and recent minor swing highs. |
| $9.75 | $9.50 - $10.00 | Strong | Recent major swing high and upper Bollinger Band area. |
Potential Chart Patterns in Formation
| Strength | Pattern | Signal | Target | Details |
|---|---|---|---|---|
| Weak | Head and Shoulders (Potential) | Bearish | N/A | A possible large, messy head and shoulders topping pattern may be forming with the head around 12.00 and shoulders around 9.50 - 10.00. |
| Strong | Downtrend Channel | Bearish | $6.80 | Price is making lower highs and lower lows since the recent peak near 10.00, forming a short-term bearish channel. |
Frequently Asked Questions about IBRX
What is the current sentiment for IBRX?
The short-term sentiment for IBRX is currently Bearish because Price is in a short-term downtrend, closing below the 50-day moving average. MACD line is below the signal line and below zero, with a negative histogram. RSI is around 40 and pointing down, indicating bearish momentum.. The long-term trend is classified as Bullish.
What are the key support levels for IBRX?
StockDips.AI has identified key support levels for IBRX at $6.90 and $5.85. These levels may represent potential accumulation zones where buying interest could emerge.
Is IBRX in a significant dip or a Value Dip right now?
IBRX has a Value Score of 81/100. It is currently flagged as a significant dip in the Top Dips list. It is also listed as a Value Dip because long-term sentiment is bullish.
View the full interactive analysis on StockDips.AI.