CRSP Daily Technical Analysis
CRISPR Therapeutics AG
A biotechnology company that develops gene-based medicines.
CRSP Technical Analysis Summary
CRSP presents a bearish technical profile across both short and long-term timeframes. The recent breakdown below the critical 52-55 support zone and major moving averages indicates a significant shift in momentum. Long-term investors should exercise caution as the impending 'death cross' and negative momentum indicators suggest further downside risk until a lower base is established.
Included In Lists
Related Tickers of Interest
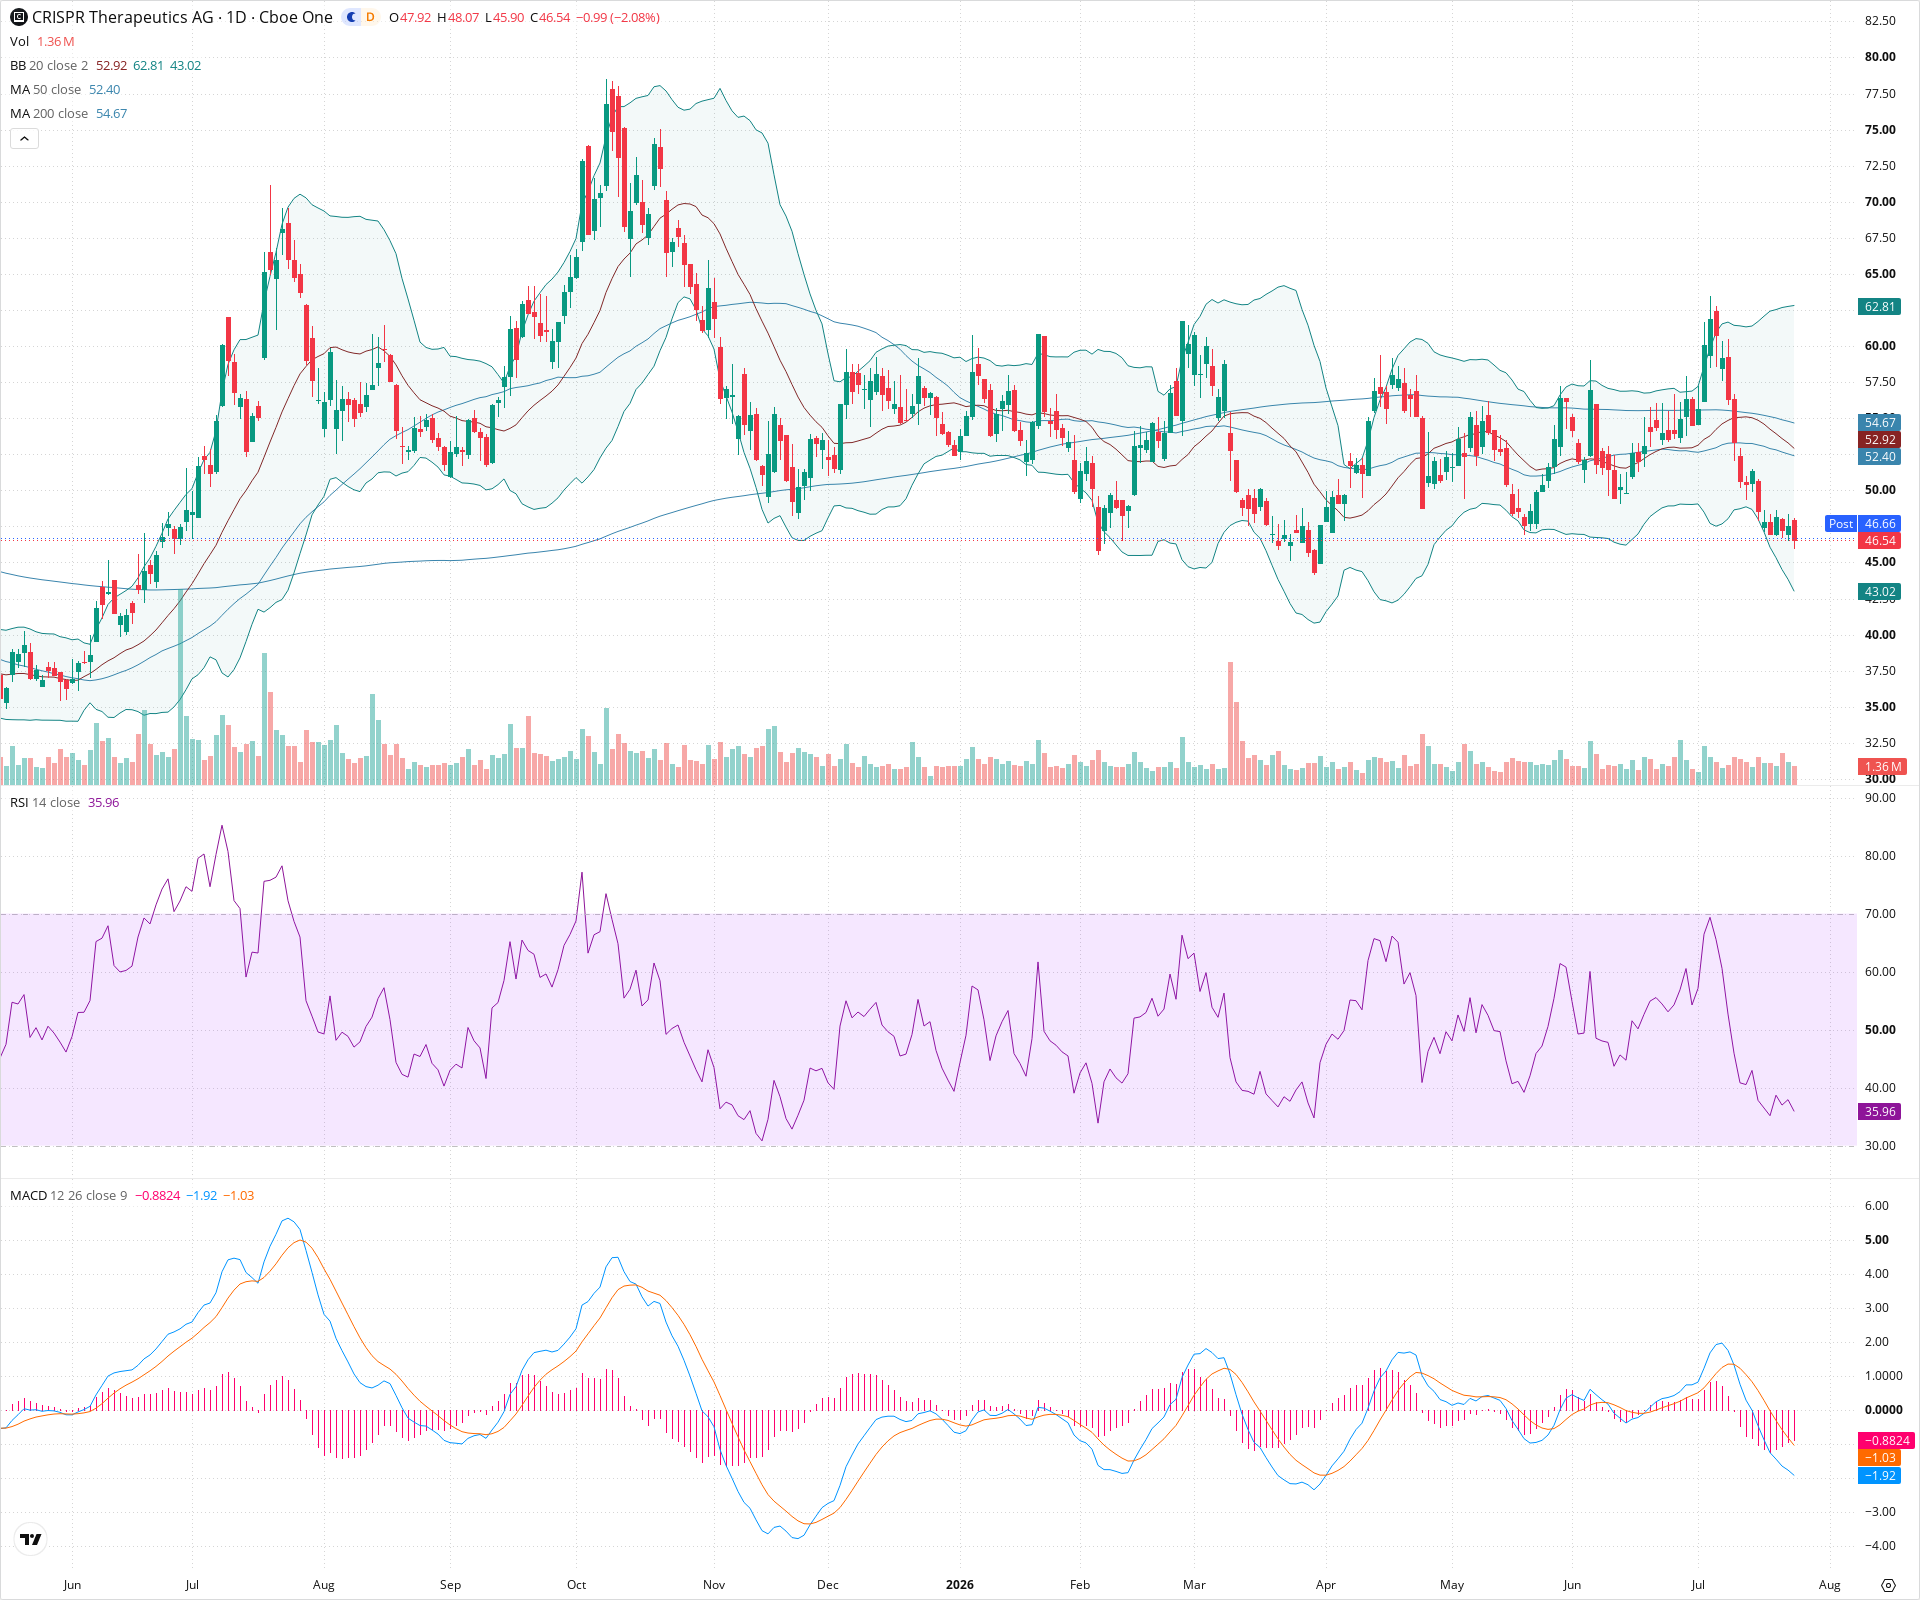
CRSP Daily Chart
Sentiment
Short-term Sentiment (days to weeks): Bearish
Price is in a steep short-term downtrend, trading below the 20, 50, and 200-day SMAs. It is hugging the lower Bollinger Band with RSI falling towards oversold levels and MACD histogram expanding negatively.
Long-term Sentiment (weeks to months): Bearish
The broader trend has shifted negatively as price decisively broke below the 200-day SMA, and the 50-day SMA is on the verge of crossing below the 200-day SMA (a death cross), indicating long-term weakness.
Report Metadata
- Timeframe: daily
- Generated at: 2026-07-24T21:15:06.999Z
- Model: gemini-3.1-pro-preview
Support Price Levels
| Level | Range | Strength | Notes |
|---|---|---|---|
| $43.00 | $42.00 - $44.00 | Strong | Previous major swing low support zone from earlier in the year. |
| $38.00 | $37.00 - $39.00 | Weak | Historical base consolidation area prior to the large uptrend on the left side of the chart. |
Resistance Price Levels
| Level | Range | Strength | Notes |
|---|---|---|---|
| $53.50 | $52.00 - $55.00 | Strong | Major former support zone turned resistance, currently reinforced by the cluster of the 50-day and 200-day SMAs. |
| $63.00 | $62.00 - $64.00 | Strong | Recent significant swing high resistance level prior to the recent breakdown. |
Potential Chart Patterns in Formation
| Strength | Pattern | Signal | Target | Details |
|---|---|---|---|---|
| Strong | Moving Average Breakdown | Bearish | N/A | Price has decisively broken below a long-standing support zone and the 200-day SMA, confirming a structural trend change to the downside. |
Frequently Asked Questions about CRSP
What is the current sentiment for CRSP?
The short-term sentiment for CRSP is currently Bearish because Price is in a steep short-term downtrend, trading below the 20, 50, and 200-day SMAs. It is hugging the lower Bollinger Band with RSI falling towards oversold levels and MACD histogram expanding negatively.. The long-term trend is classified as Bearish.
What are the key support levels for CRSP?
StockDips.AI has identified key support levels for CRSP at $43.00 and $38.00. These levels may represent potential accumulation zones where buying interest could emerge.
Is CRSP in a significant dip or a Value Dip right now?
CRSP has a Value Score of 66/100. It is not currently flagged as a significant dip in the Top Dips list. It is not listed as a Value Dip because the long-term sentiment or value-score threshold does not qualify.
View the full interactive analysis on StockDips.AI.