LLY Daily Technical Analysis
Eli Lilly & Co.
Pharma leader in diabetes and obesity treatments including Mounjaro and Zepbound.
This is a historical daily technical analysis report for LLY, generated on July 24, 2026 at 9:03 PM UTC.
LLY Technical Analysis Summary
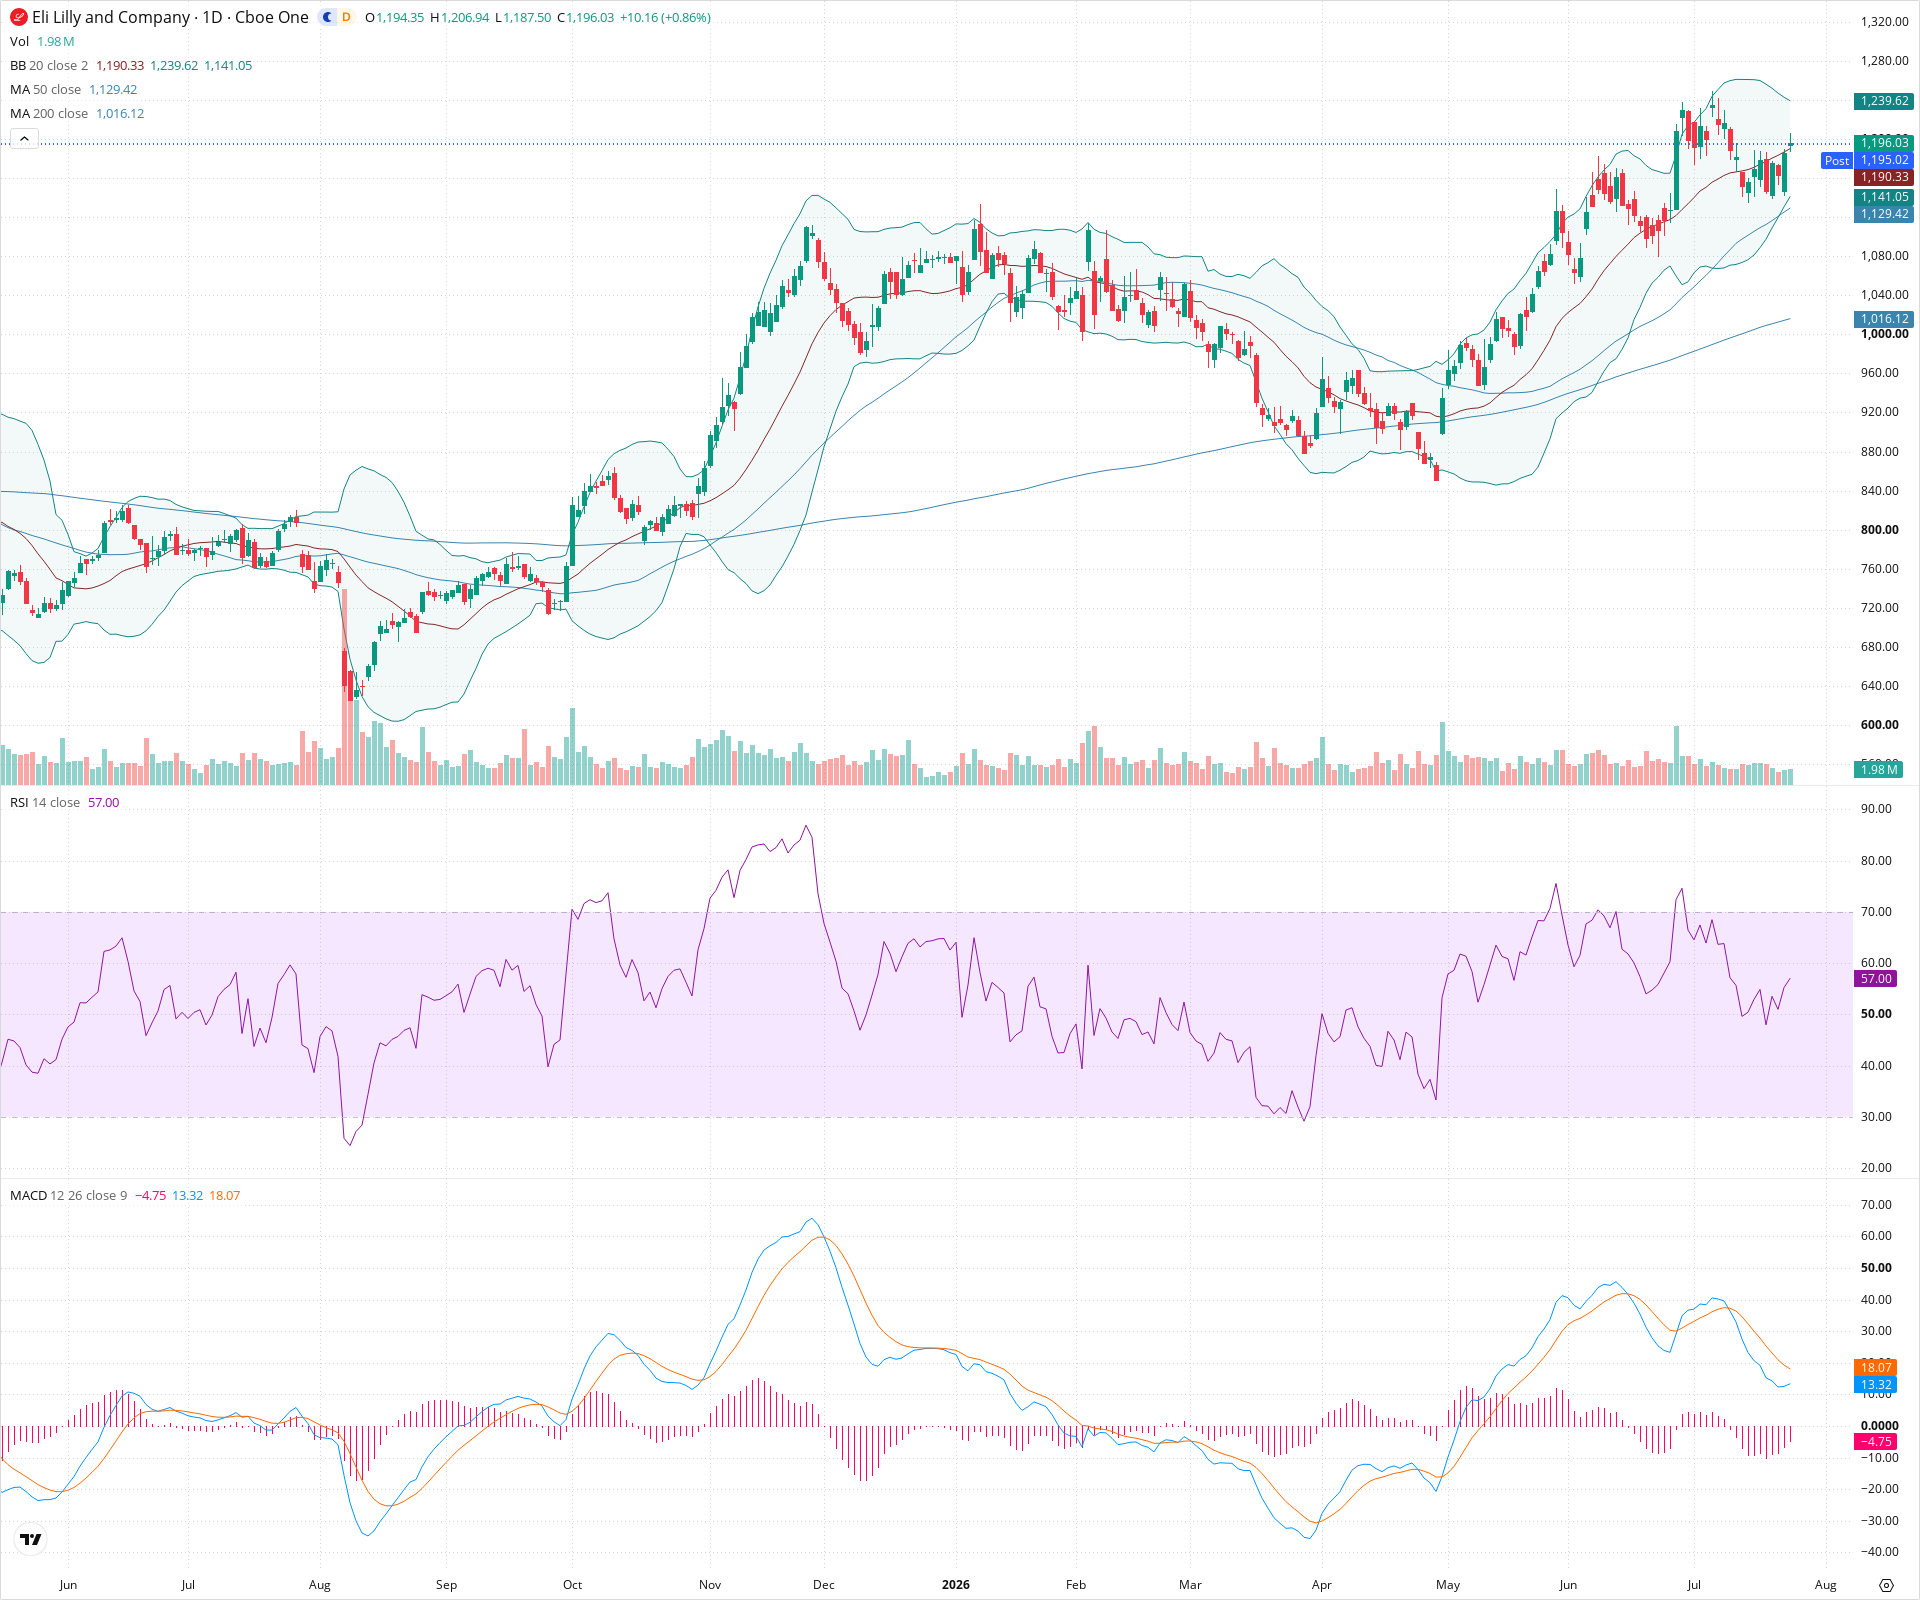
LLY is in a well-established long-term uptrend, demonstrating technical strength by holding above key moving averages. The recent pullback appears to be a healthy correction that found strong support at the 50-day SMA. With short-term momentum indicators turning positive, the technical setup favors a retest of recent highs as long as the support zone near 1140 is maintained.
Included In Lists
Related Tickers of Interest
Historical Report Navigation
Browse adjacent archived reports or jump back to the latest live analysis page.
LLY Daily Chart
Sentiment
Short-term Sentiment (days to weeks): Bullish
Price successfully tested the 50-day SMA as support and has rebounded above the 20-day SMA. RSI is rising back above 50, and the MACD histogram is contracting toward zero, suggesting waning bearish momentum and a potential bullish crossover.
Long-term Sentiment (weeks to months): Bullish
The chart displays a robust and sustained uptrend characterized by a sequence of higher highs and higher lows. The price remains comfortably above both the rising 50-day and 200-day simple moving averages.
Report Metadata
- Timeframe: daily
- Generated at: Jul 24, 2026
- Model: gemini-3.1-pro-preview
Support Price Levels
| Level | Range | Strength | Notes |
|---|---|---|---|
| $1,140.00 | $1,130.00 - $1,150.00 | Strong | Recent swing low coinciding closely with the rising 50-day SMA. |
| $1,090.00 | $1,080.00 - $1,100.00 | Strong | Prior area of choppy consolidation before the most recent leg higher. |
Resistance Price Levels
| Level | Range | Strength | Notes |
|---|---|---|---|
| $1,242.50 | $1,235.00 - $1,250.00 | Strong | Recent swing high / all-time high area before the recent pullback. |
Potential Chart Patterns in Formation
| Strength | Pattern | Signal | Target | Details |
|---|---|---|---|---|
| Strong | Moving Average Bounce | Bullish | N/A | Price corrected down to the rising 50-day SMA, found support, and is establishing a new swing low, indicating trend continuation. |
Frequently Asked Questions about LLY
What is the current sentiment for LLY?
The short-term sentiment for LLY is currently Bullish because Price successfully tested the 50-day SMA as support and has rebounded above the 20-day SMA. RSI is rising back above 50, and the MACD histogram is contracting toward zero, suggesting waning bearish momentum and a potential bullish crossover. The long-term trend is classified as Bullish.
What are the key support levels for LLY?
StockDips.AI has identified key support levels for LLY at $1,140.00 and $1,090.00. These levels may represent potential accumulation zones where buying interest could emerge.
Is LLY in a significant dip or a Value Dip right now?
LLY has a Value Score of 34/100. It is not currently flagged as a significant dip in the Top Dips list. It is not listed as a Value Dip because the long-term sentiment or value-score threshold does not qualify.
View the full interactive analysis on StockDips.AI.