LNG Daily Technical Analysis
Cheniere Energy, Inc.
Leading U.S. LNG exporter operating major liquefaction facilities supplying natural gas to Europe and Asia.
This is a historical daily technical analysis report for LNG, generated on June 2, 2026 at 2:12 PM UTC.
LNG Technical Analysis Summary
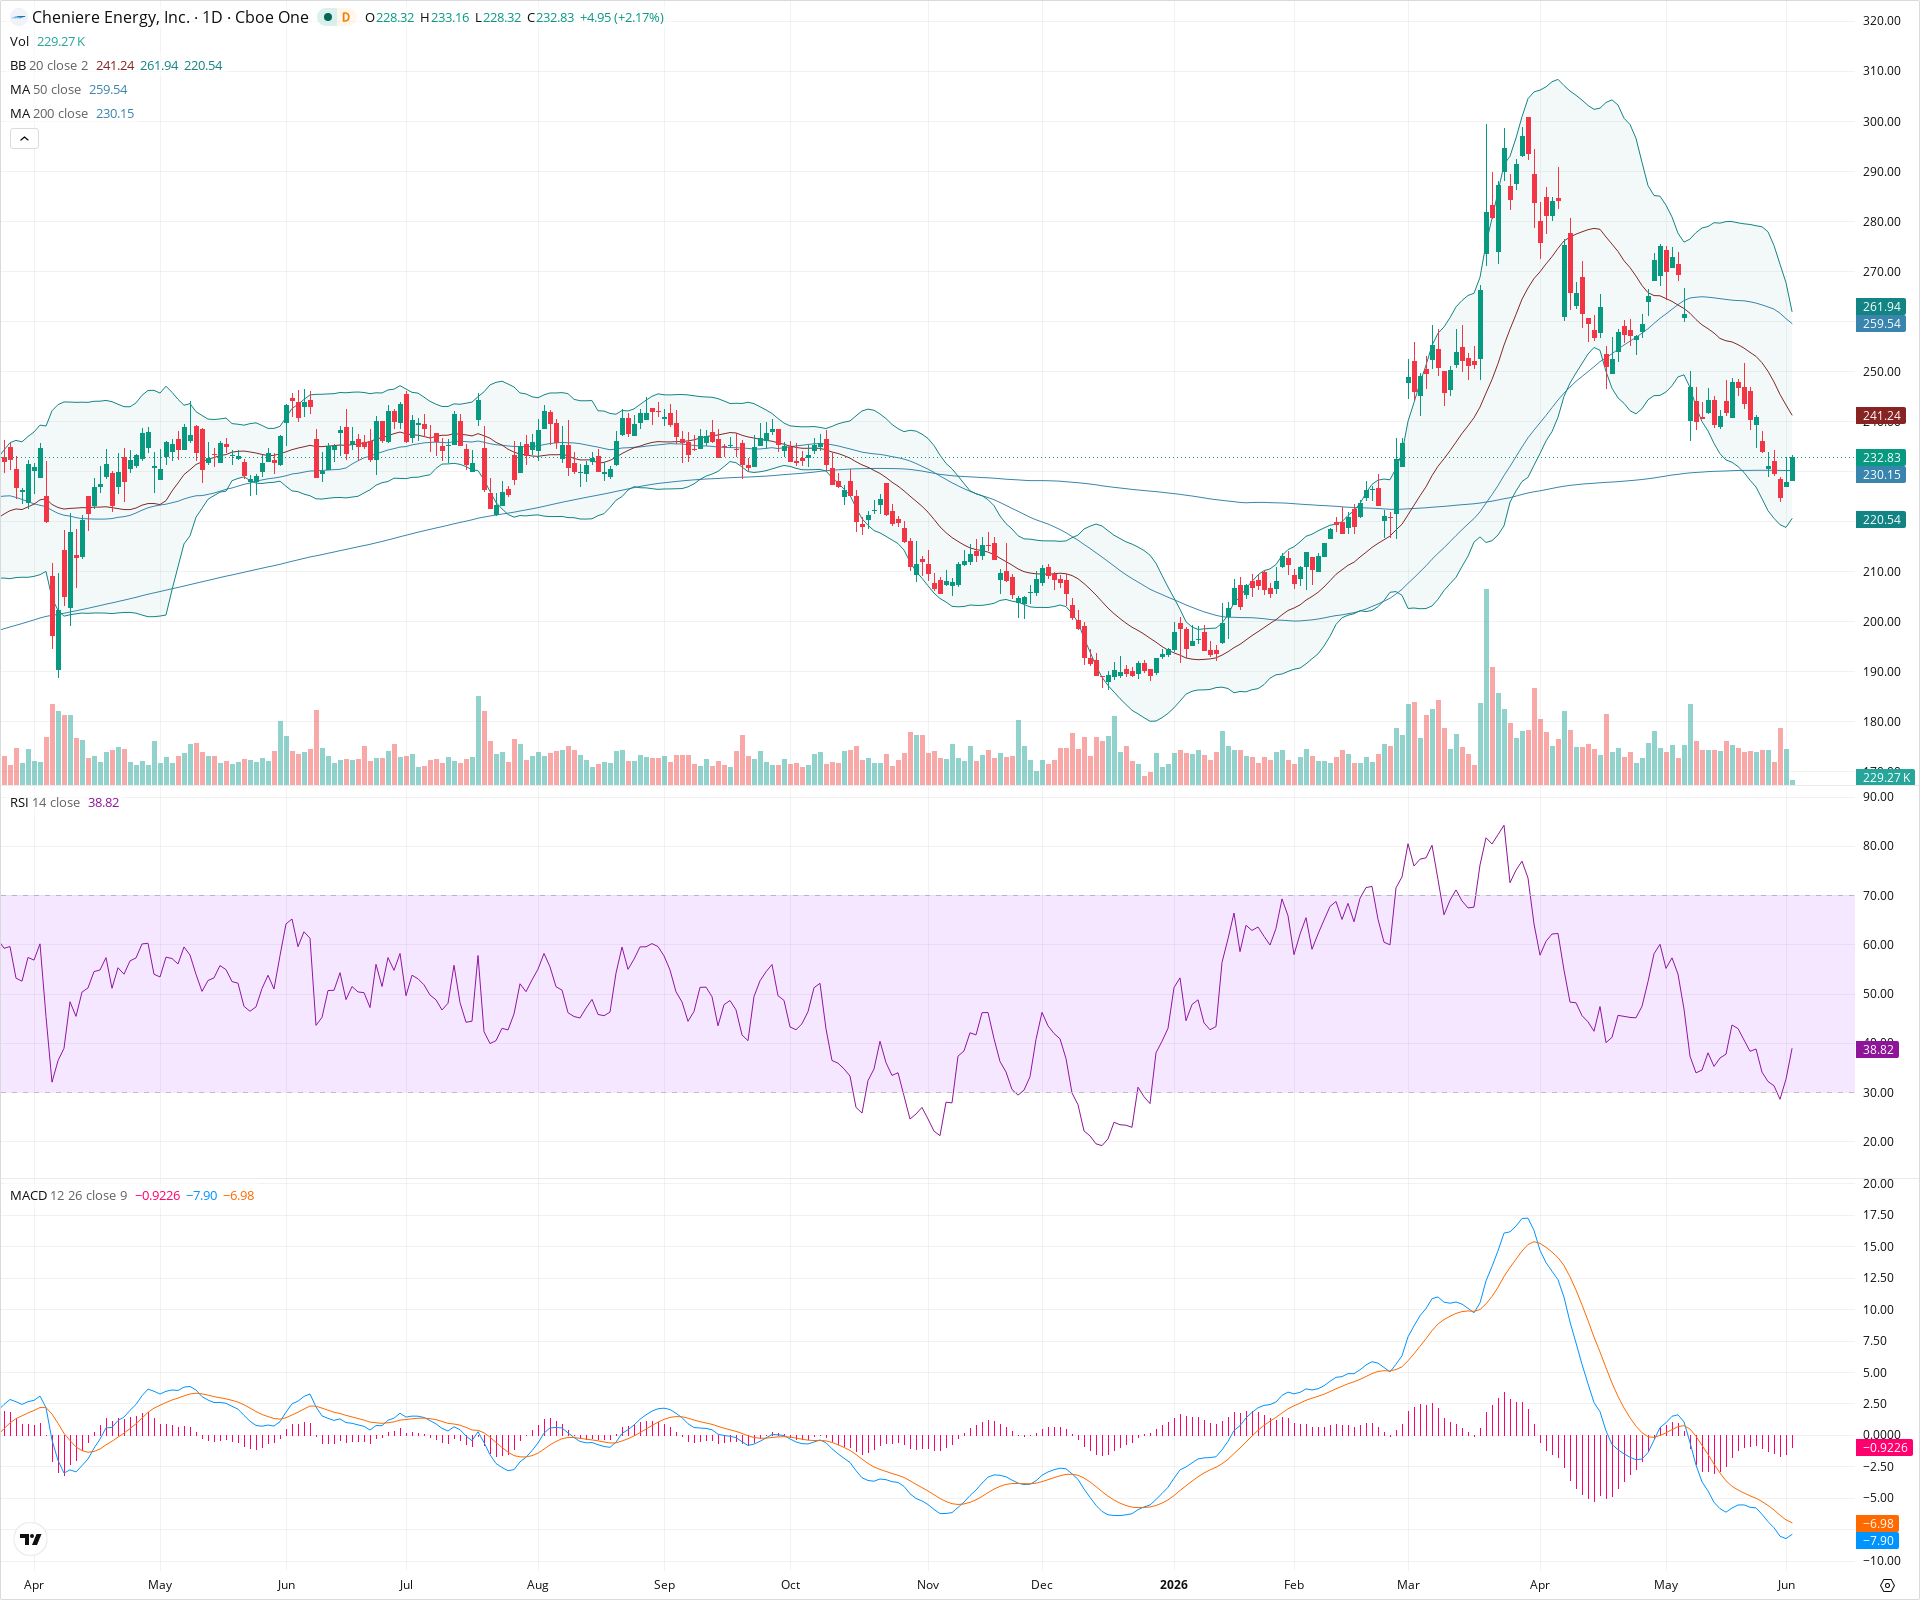
LNG has undergone a severe technical correction from its highs near 300, breaking through the 50-day SMA with strong downward momentum. The asset became deeply oversold and is currently finding a critical floor at the rising 200-day SMA. While a short-term bounce is underway, the substantial technical damage suggests a neutral long-term outlook until the price can establish a new base and reclaim overhead moving averages.
Included In Lists
Related Tickers of Interest
Historical Report Navigation
Browse adjacent archived reports or jump back to the latest live analysis page.
LNG Daily Chart
Sentiment
Short-term Sentiment (days to weeks): Neutral
Price is attempting an oversold bounce after a steep decline, having touched the lower Bollinger Band and RSI dipping below 30. However, the price remains well below the declining 50-day SMA and middle Bollinger Band, keeping the immediate trend pressured.
Long-term Sentiment (weeks to months): Neutral
The stock has suffered a massive correction from its highs, breaking significant support levels including the 50-day SMA. However, the long-term uptrend is technically hanging on as price is currently finding support at the rising 200-day SMA.
Report Metadata
- Timeframe: daily
- Generated at: Jun 2, 2026
- Model: gemini-3.1-pro-preview
Support Price Levels
| Level | Range | Strength | Notes |
|---|---|---|---|
| $228.50 | $226.00 - $231.00 | Strong | Recent swing low zone that aligns perfectly with the rising 200-day SMA, acting as a critical line in the sand for bulls. |
| $190.00 | $185.00 - $195.00 | Strong | Major historical consolidation and basing area from prior to the large run-up, representing deep structural support. |
Resistance Price Levels
| Level | Range | Strength | Notes |
|---|---|---|---|
| $242.50 | $240.00 - $245.00 | Weak | First area of overhead resistance near the middle Bollinger Band and a minor prior support level that broke down. |
| $260.00 | $258.00 - $262.00 | Strong | Significant dynamic resistance zone defined by the declining 50-day SMA. |
| $280.00 | $275.00 - $285.00 | Strong | Previous lower high established during the downtrend sequence. |
Potential Chart Patterns in Formation
| Strength | Pattern | Signal | Target | Details |
|---|---|---|---|---|
| Weak | Oversold Rebound | Bullish | $242.00 | Price reached an extreme oversold condition (RSI < 30, lower BB touch) and is reacting with a short-term relief rally off a major moving average. |
| Strong | Steep Correction | Bearish | N/A | A sharp, high-momentum pullback from peak highs, indicating a significant shift in recent momentum from bullish to bearish. |
Frequently Asked Questions about LNG
What is the current sentiment for LNG?
The short-term sentiment for LNG is currently Neutral because Price is attempting an oversold bounce after a steep decline, having touched the lower Bollinger Band and RSI dipping below 30. However, the price remains well below the declining 50-day SMA and middle Bollinger Band, keeping the immediate trend pressured. The long-term trend is classified as Neutral.
What are the key support levels for LNG?
StockDips.AI has identified key support levels for LNG at $228.50 and $190.00. These levels may represent potential accumulation zones where buying interest could emerge.
Is LNG in a significant dip or a Value Dip right now?
LNG has a Value Score of 44/100. It is not currently flagged as a significant dip in the Top Dips list. It is not listed as a Value Dip because the long-term sentiment or value-score threshold does not qualify.
View the full interactive analysis on StockDips.AI.