LNG Daily Technical Analysis
Cheniere Energy, Inc.
Leading U.S. LNG exporter operating major liquefaction facilities supplying natural gas to Europe and Asia.
This is a historical daily technical analysis report for LNG, generated on June 8, 2026 at 9:09 PM UTC.
LNG Technical Analysis Summary
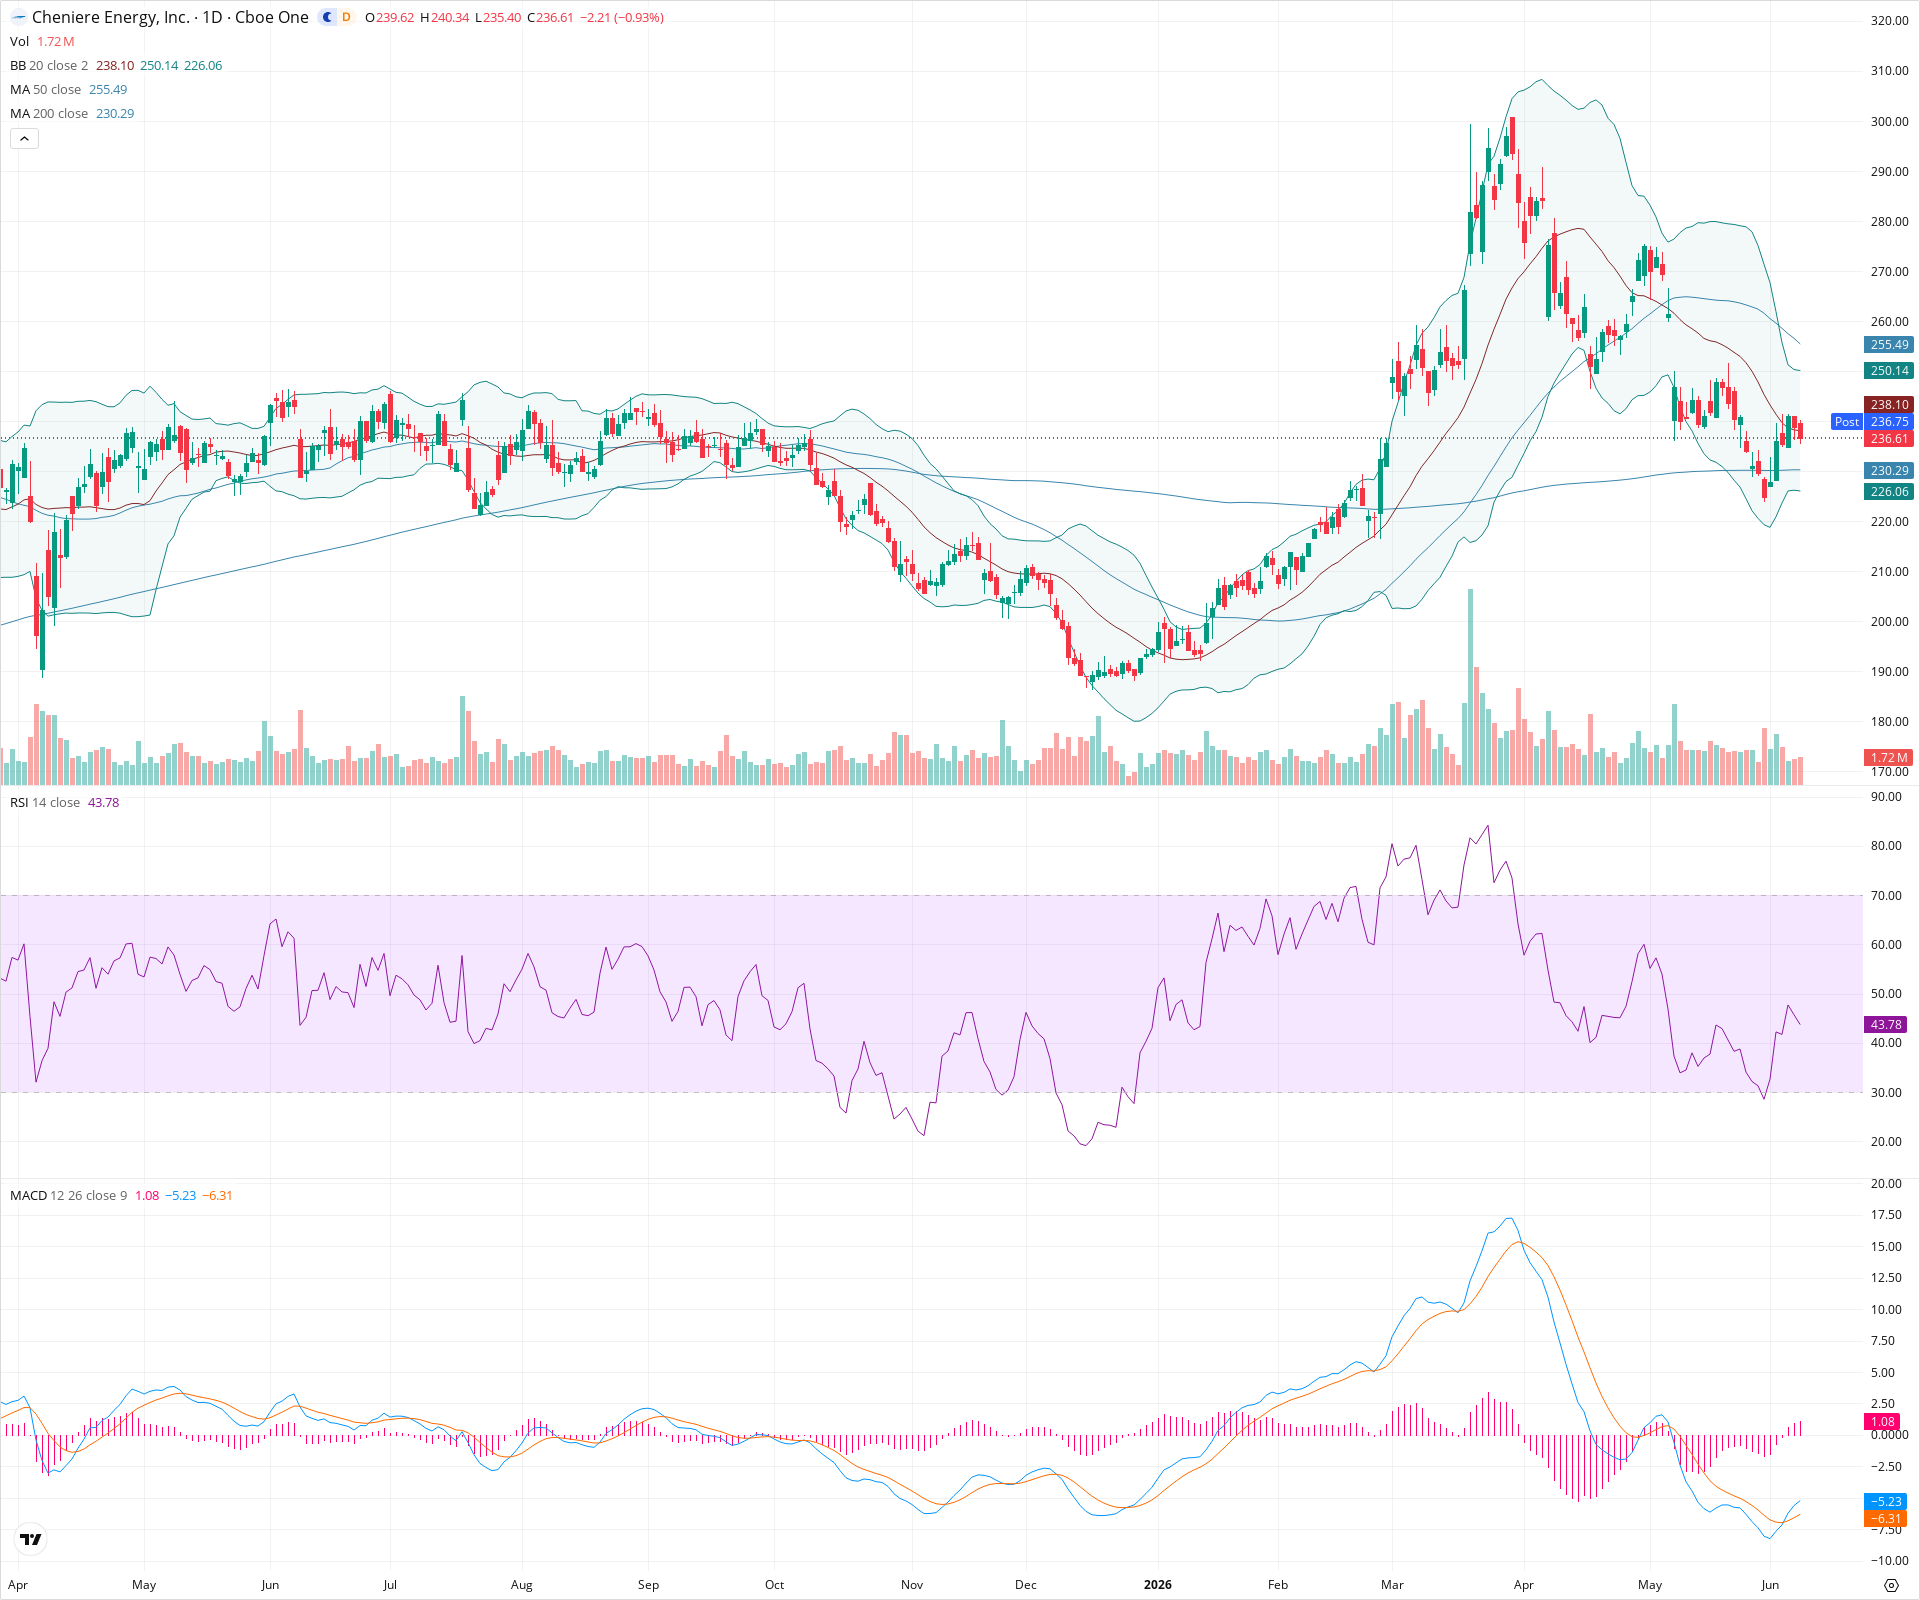
LNG is currently undergoing a significant consolidation phase after a sharp retracement from its previous highs near 300. The technical picture suggests the stock is trying to establish a firm base around the critical 200-day SMA support zone. While short-term moving averages act as immediate overhead resistance, positive momentum shifts in the MACD indicate that the selling pressure may be exhausting, presenting a potential area of interest for long-term trend continuation if support holds.
Included In Lists
Related Tickers of Interest
Historical Report Navigation
Browse adjacent archived reports or jump back to the latest live analysis page.
LNG Daily Chart
Sentiment
Short-term Sentiment (days to weeks): Neutral
Price is currently consolidating in a range, trapped between support at the 200-day SMA and resistance from the 20-day and 50-day SMAs. A recent bullish MACD crossover suggests selling momentum is waning, but a definitive trend reversal is not yet confirmed.
Long-term Sentiment (weeks to months): Bullish
The broader trend remains structurally positive as the price is holding above the rising 200-day SMA following a massive prior rally. Additionally, the 50-day SMA is still positioned above the 200-day SMA, indicating a long-term uptrend despite the recent deep correction.
Report Metadata
- Timeframe: daily
- Generated at: Jun 8, 2026
- Model: gemini-3.1-pro-preview
Support Price Levels
| Level | Range | Strength | Notes |
|---|---|---|---|
| $228.50 | $225.00 - $232.00 | Strong | Crucial support zone defined by the current 200-day SMA and recent swing lows where price has bounced twice. |
| $195.00 | $190.00 - $200.00 | Strong | Major historical consolidation base and breakout level from earlier in the chart. |
Resistance Price Levels
| Level | Range | Strength | Notes |
|---|---|---|---|
| $250.50 | $245.00 - $256.00 | Strong | Significant overhead resistance zone containing the declining 50-day SMA and recent lower highs. |
| $302.50 | $295.00 - $310.00 | Strong | The major structural peak and swing high from earlier in the year. |
Potential Chart Patterns in Formation
| Strength | Pattern | Signal | Target | Details |
|---|---|---|---|---|
| Weak | Potential Double Bottom / Base Formation | Bullish | $255.00 | Price has tested the 225-230 area twice, forming a potential higher low near the 200-day SMA. A recent bullish MACD crossover supports the idea of a base forming. |
Frequently Asked Questions about LNG
What is the current sentiment for LNG?
The short-term sentiment for LNG is currently Neutral because Price is currently consolidating in a range, trapped between support at the 200-day SMA and resistance from the 20-day and 50-day SMAs. A recent bullish MACD crossover suggests selling momentum is waning, but a definitive trend reversal is not yet confirmed. The long-term trend is classified as Bullish.
What are the key support levels for LNG?
StockDips.AI has identified key support levels for LNG at $228.50 and $195.00. These levels may represent potential accumulation zones where buying interest could emerge.
Is LNG in a significant dip or a Value Dip right now?
LNG has a Value Score of 44/100. It is not currently flagged as a significant dip in the Top Dips list. It is not listed as a Value Dip because the long-term sentiment or value-score threshold does not qualify.
View the full interactive analysis on StockDips.AI.