MELI Daily Technical Analysis
MercadoLibre Inc
Latin America's leading e-commerce and digital payments company.
MELI Technical Analysis Summary
MELI is currently showing short-term bullish momentum, recovering from recent lows and pushing towards the 200-day SMA. Long-term, the picture remains mixed as the 50-day SMA is below the 200-day SMA, suggesting a broader corrective or consolidative phase. A sustained break above the 1900-1910 resistance zone is needed to improve the longer-term outlook, while failure to hold the 1680-1700 support could invite further downside.
Included In Lists
Related Tickers of Interest
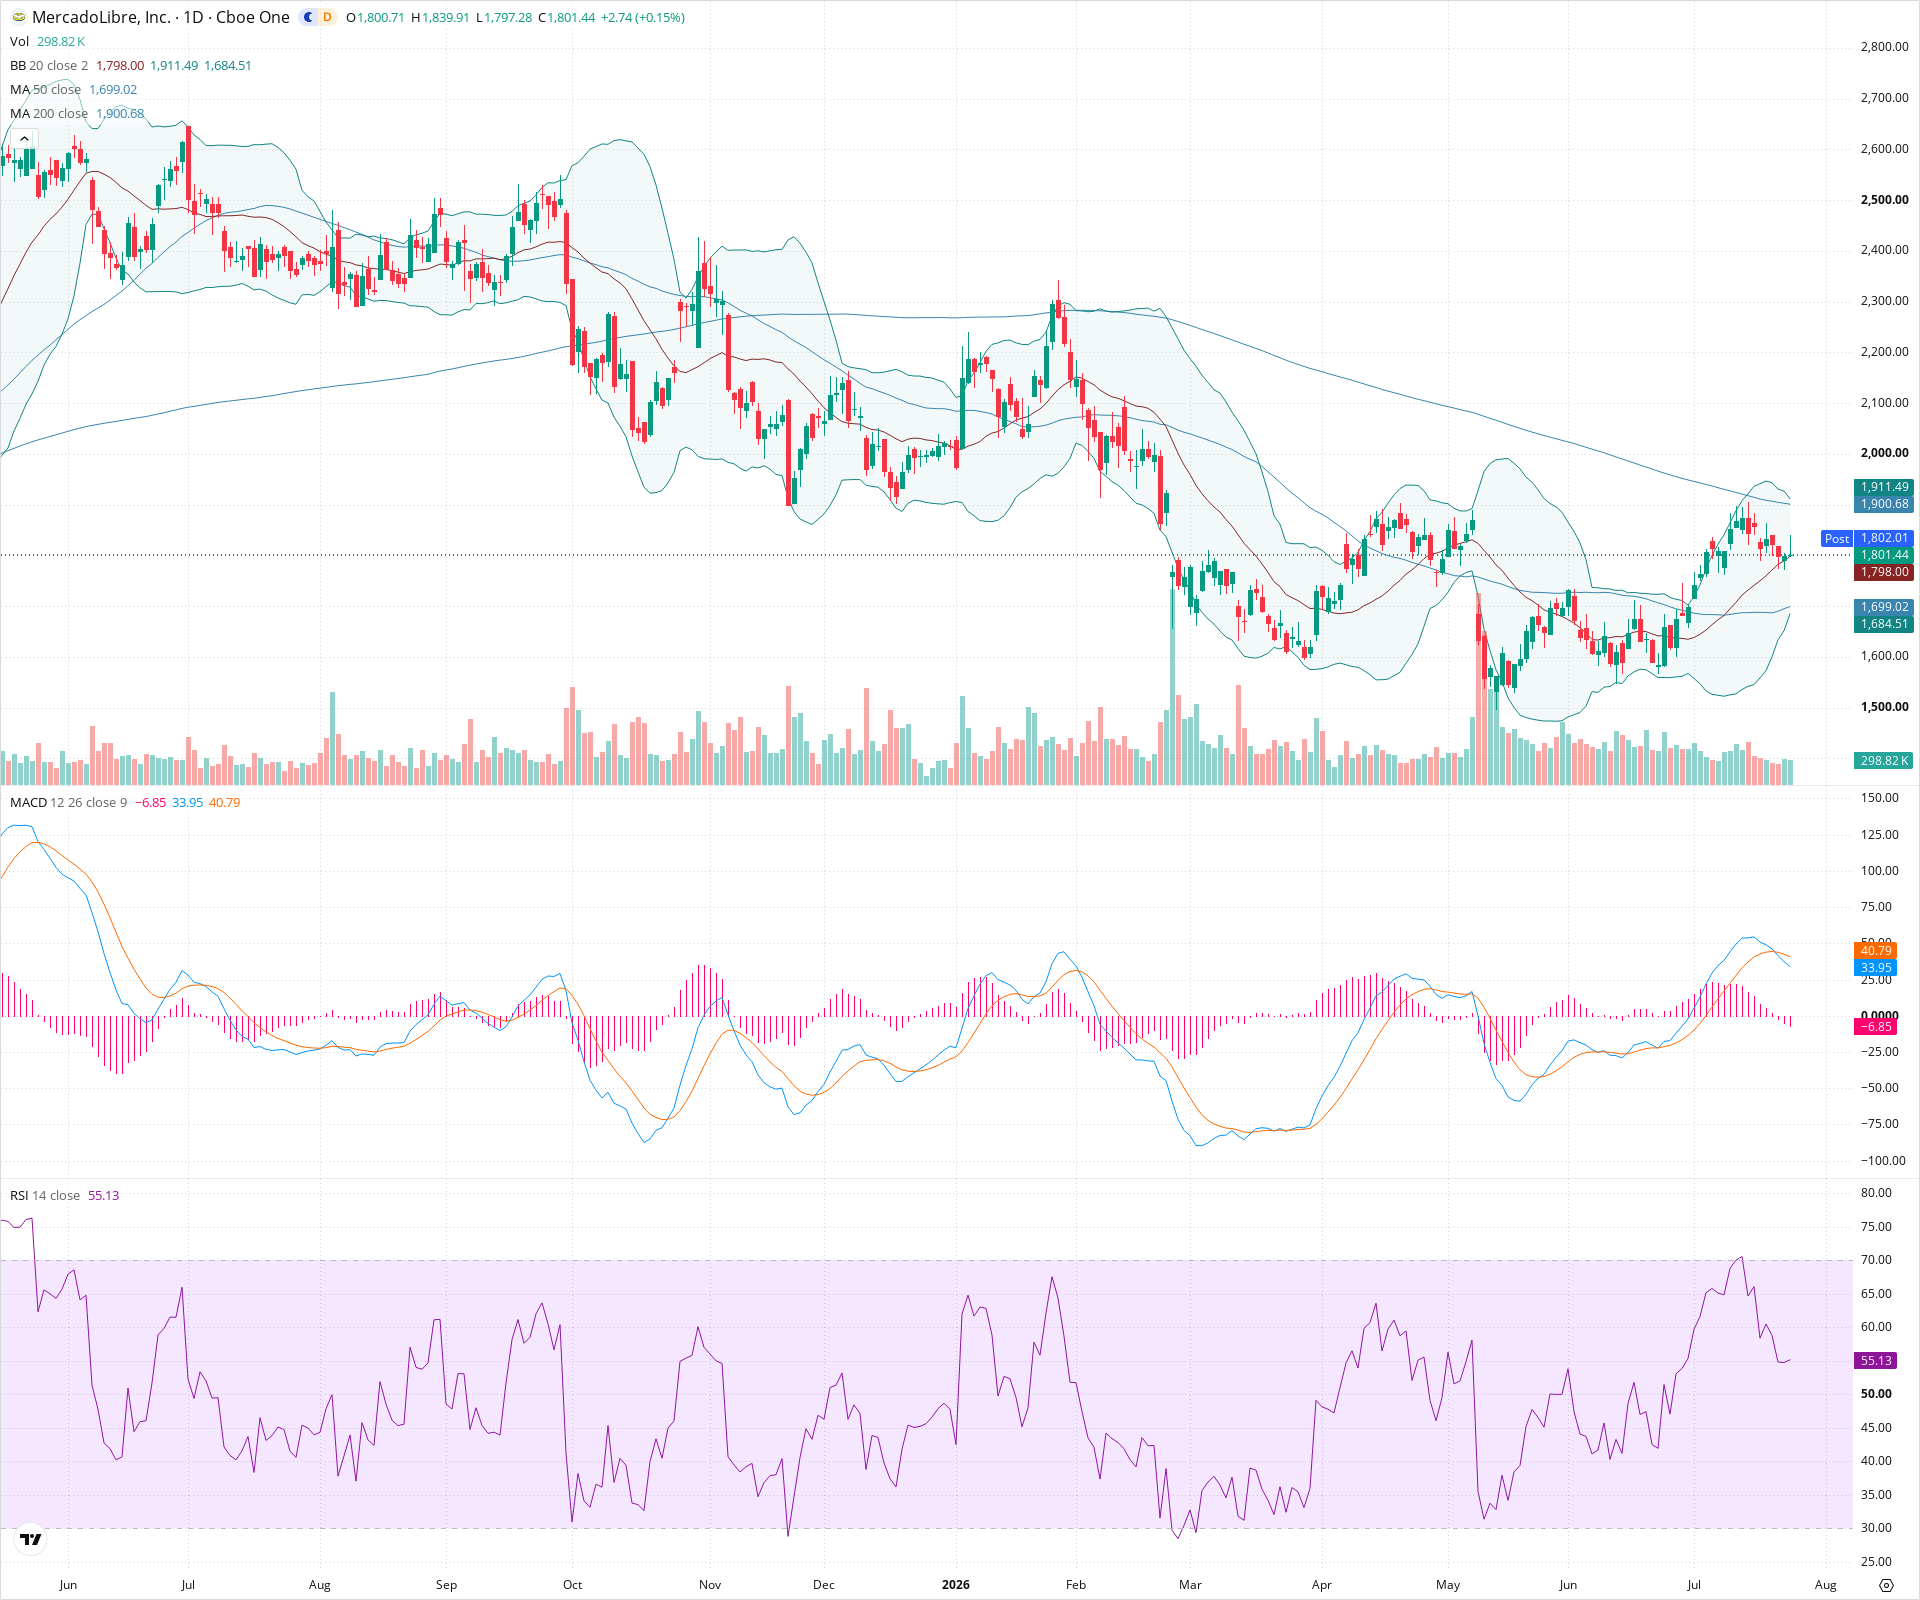
MELI Daily Chart
Sentiment
Short-term Sentiment (days to weeks): Bullish
Price is trading above the 50-day and 200-day SMAs and has been in a short-term uptrend. The RSI is around 55, indicating bullish momentum without being overbought. However, a recent slight pullback suggests some near-term consolidation.
Long-term Sentiment (weeks to months): Neutral
The price has been ranging between roughly 1500 and 1900 over the past few months. The 50-day SMA is below the 200-day SMA, which is a longer-term bearish signal, although the recent price action indicates a potential trend reversal or prolonged consolidation.
Report Metadata
- Timeframe: daily
- Generated at: 2026-07-24T21:17:02.799Z
- Model: gemini-3.1-pro-preview
Support Price Levels
| Level | Range | Strength | Notes |
|---|---|---|---|
| $1,690.00 | $1,680.00 - $1,700.00 | Strong | Coincides with the 50-day SMA and recent swing lows before the latest leg up. |
| $1,590.00 | $1,580.00 - $1,600.00 | Strong | Recent major swing low and significant consolidation area. |
Resistance Price Levels
| Level | Range | Strength | Notes |
|---|---|---|---|
| $1,900.00 | $1,890.00 - $1,910.00 | Strong | Recent swing high, coincides with the 200-day SMA and upper Bollinger Band. |
| $2,000.00 | $1,980.00 - $2,020.00 | Weak | Psychological level and previous minor swing highs. |
Potential Chart Patterns in Formation
| Strength | Pattern | Signal | Target | Details |
|---|---|---|---|---|
| Strong | Ascending Channel / Uptrend | Bullish | $1,910.00 | Price has been forming higher highs and higher lows since the dip below 1600, currently navigating between the 50-day and 200-day SMAs. |
Frequently Asked Questions about MELI
What is the current sentiment for MELI?
The short-term sentiment for MELI is currently Bullish because Price is trading above the 50-day and 200-day SMAs and has been in a short-term uptrend. The RSI is around 55, indicating bullish momentum without being overbought. However, a recent slight pullback suggests some near-term consolidation.. The long-term trend is classified as Neutral.
What are the key support levels for MELI?
StockDips.AI has identified key support levels for MELI at $1,690.00 and $1,590.00. These levels may represent potential accumulation zones where buying interest could emerge.
Is MELI in a significant dip or a Value Dip right now?
MELI has a Value Score of 47/100. It is not currently flagged as a significant dip in the Top Dips list. It is not listed as a Value Dip because the long-term sentiment or value-score threshold does not qualify.
View the full interactive analysis on StockDips.AI.