NUAI Weekly Technical Analysis
New Era Energy & Digital, Inc
Developer and operator of next-generation digital infrastructure and integrated power assets, focusing on building data centers to support AI and high-performance computing workloads. The company provides turnkey solutions to accelerate data center deployment for hyperscale, enterprise, and edge operators, leveraging its own natural gas reserves and land in the Permian Basin.
NUAI Technical Analysis Summary
NUAI is currently exhibiting a short-term bullish bounce within a broader, long-term neutral consolidation range. The recent strong weekly close near the middle of this range suggests buying interest remains at lower levels. However, long-term commitment requires breaking above the significant resistance zone near $6.50 to establish a sustained uptrend.
Included In Lists
Related Tickers of Interest
NUAI Weekly Chart
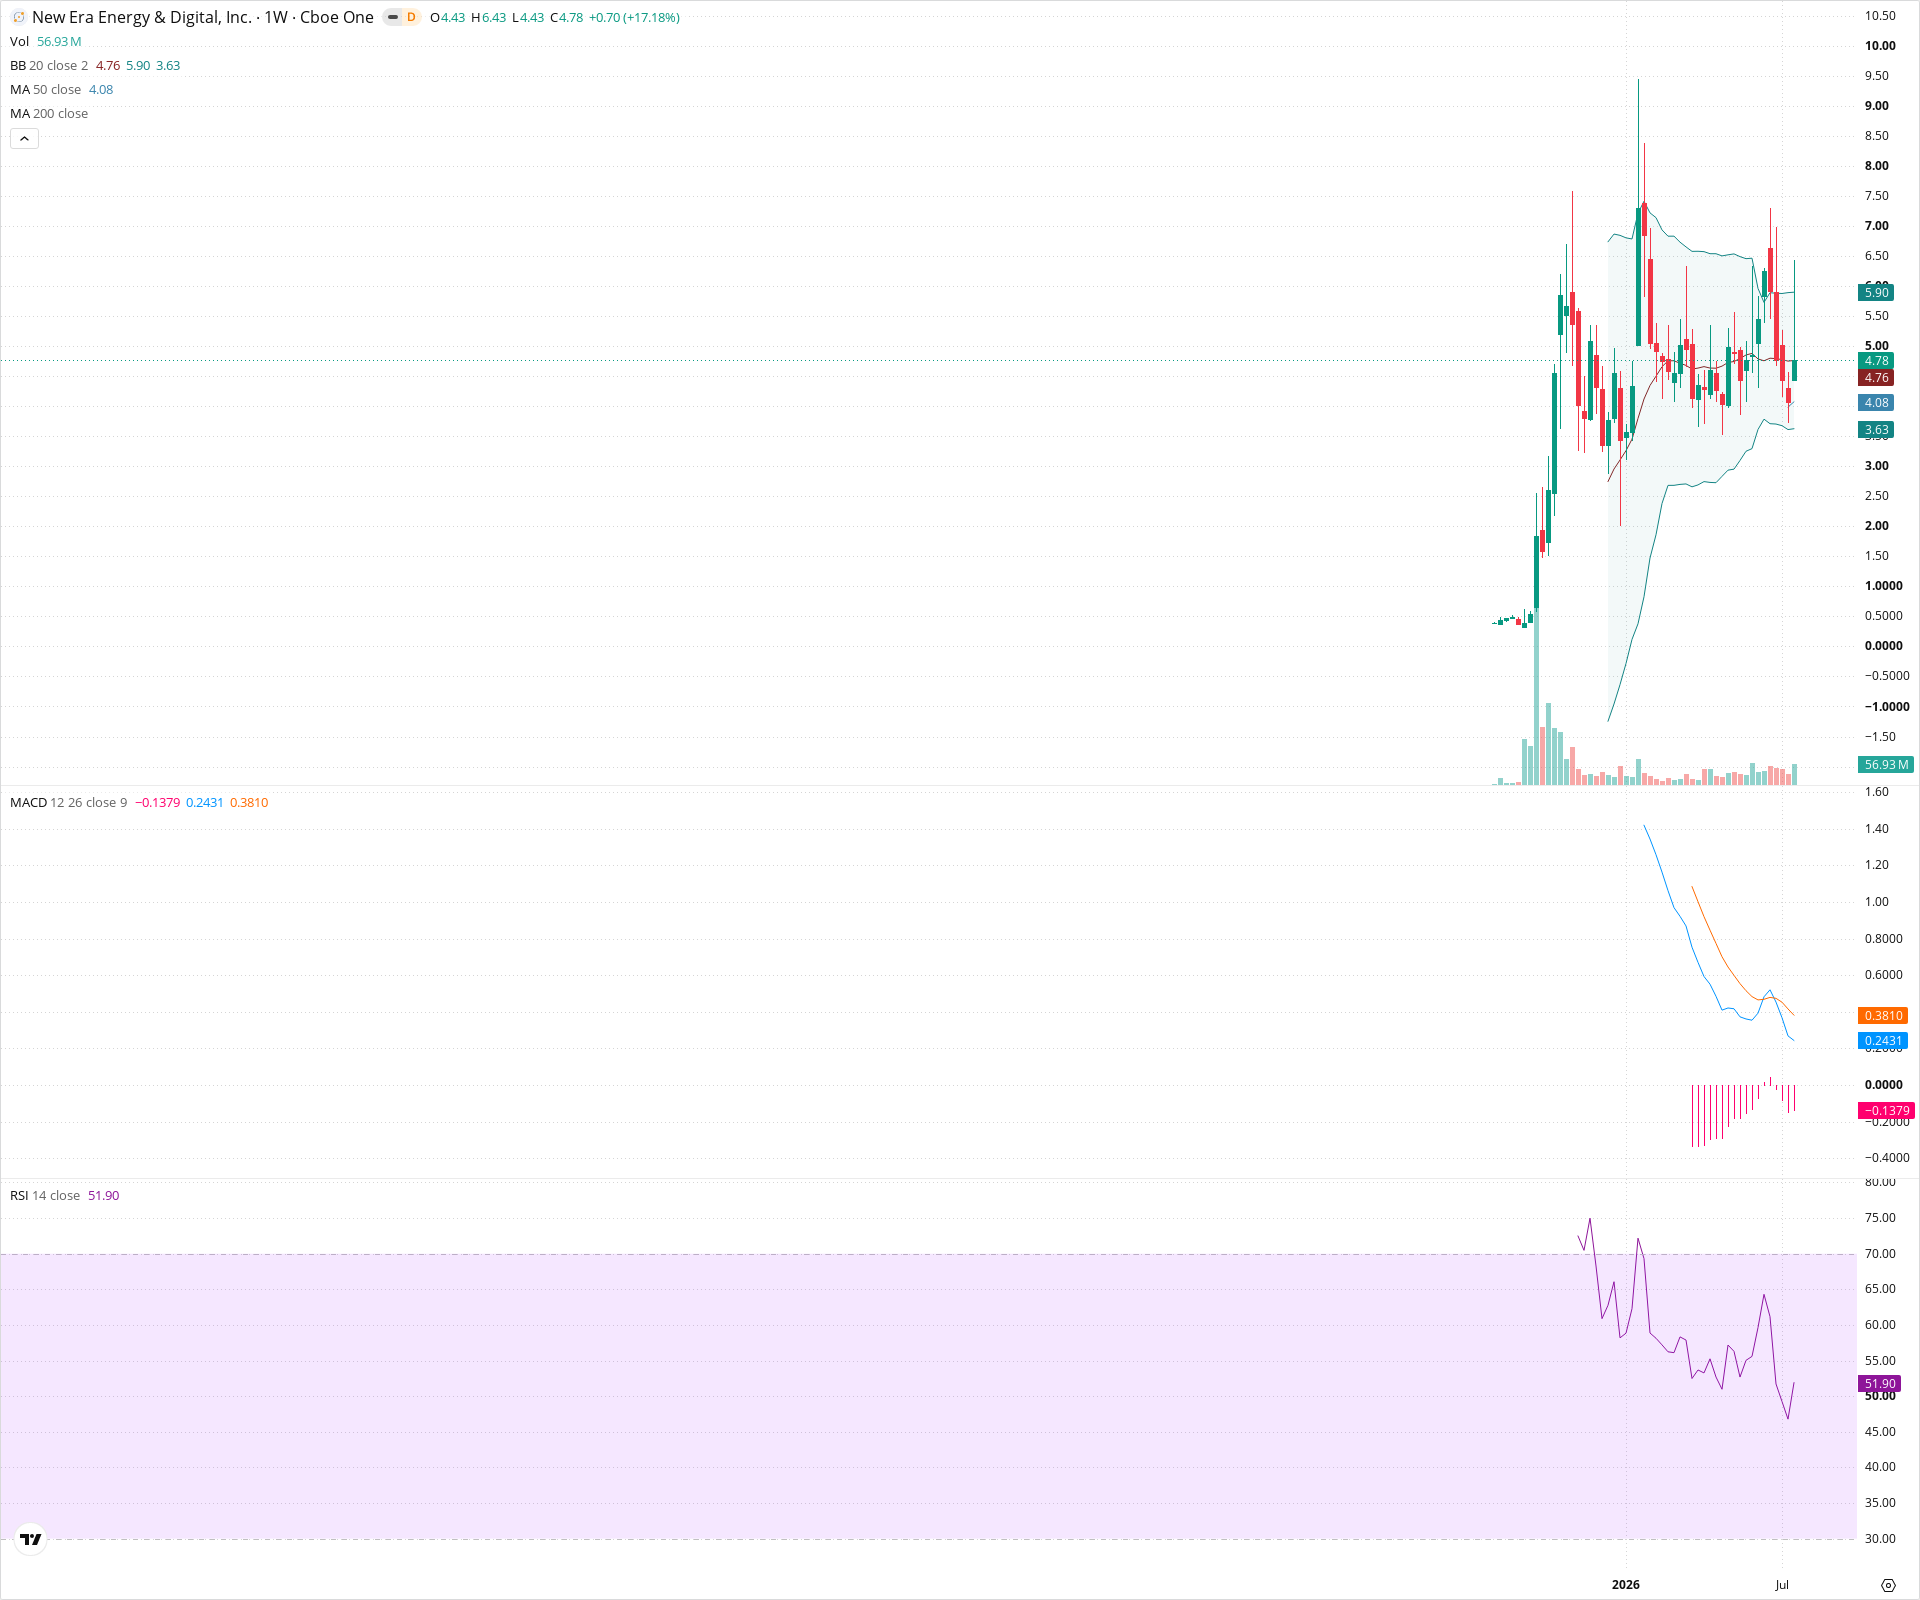
Sentiment
Short-term Sentiment (days to weeks): Bullish
Price is rebounding strongly, shown by a large green weekly candle, following a pullback near the lower Bollinger Band. The RSI is curling upwards past 50, indicating recovering momentum.
Long-term Sentiment (weeks to months): Neutral
The long-term trend appears consolidative within a broad range after an initial surge. The price is currently below the 50-period SMA but attempting a recovery, suggesting a phase of equilibrium rather than a definitive long-term trend.
Report Metadata
- Timeframe: weekly
- Generated at: 2026-07-25T09:12:09.299Z
- Model: gemini-3.1-pro-preview
Support Price Levels
| Level | Range | Strength | Notes |
|---|---|---|---|
| $3.86 | $3.63 - $4.08 | Strong | Recent consolidation low and proximity to the lower Bollinger Band and 50-period SMA, which provided substantial support during the recent pullback. |
| $2.75 | $2.50 - $3.00 | Weak | Historical base area before the major gap up and initial surge, providing structural support. |
Resistance Price Levels
| Level | Range | Strength | Notes |
|---|---|---|---|
| $6.20 | $5.90 - $6.50 | Strong | Upper region encompassing the recent swing highs and the upper Bollinger Band, presenting significant overhead supply. |
| $7.75 | $7.50 - $8.00 | Weak | Previous major peak area; psychological and structural resistance. |
Potential Chart Patterns in Formation
| Strength | Pattern | Signal | Target | Details |
|---|---|---|---|---|
| Strong | Consolidation / Range | Neutral | N/A | Price is moving predominantly sideways between $3.60 and $6.50, establishing a broad trading range after the initial vertical move. |
Frequently Asked Questions about NUAI
What is the current sentiment for NUAI?
The short-term sentiment for NUAI is currently Bullish because Price is rebounding strongly, shown by a large green weekly candle, following a pullback near the lower Bollinger Band. The RSI is curling upwards past 50, indicating recovering momentum.. The long-term trend is classified as Neutral.
What are the key support levels for NUAI?
StockDips.AI has identified key support levels for NUAI at $3.86 and $2.75. These levels may represent potential accumulation zones where buying interest could emerge.
Is NUAI in a significant dip or a Value Dip right now?
NUAI has a Value Score of 62/100. It is not currently flagged as a significant dip in the Top Dips list. It is not listed as a Value Dip because the long-term sentiment or value-score threshold does not qualify.
View the full interactive analysis on StockDips.AI.