PFE Weekly Technical Analysis
Pfizer Inc.
Global pharmaceutical company specializing in vaccines, oncology, and infectious disease treatments. Known for major blockbuster drugs and vaccine platforms.
PFE Technical Analysis Summary
The technical posture for PFE on the weekly timeframe is heavily bearish. The stock remains trapped in a long-term downtrend, trading below all major moving averages. The recent breakdown from a sideways consolidation phase, confirmed by weakening RSI and negative MACD momentum, suggests sellers remain in control. Long-term investors must watch the critical $24-$25 historical support level closely; a failure here could precipitate further sustained losses.
Included In Lists
Related Tickers of Interest
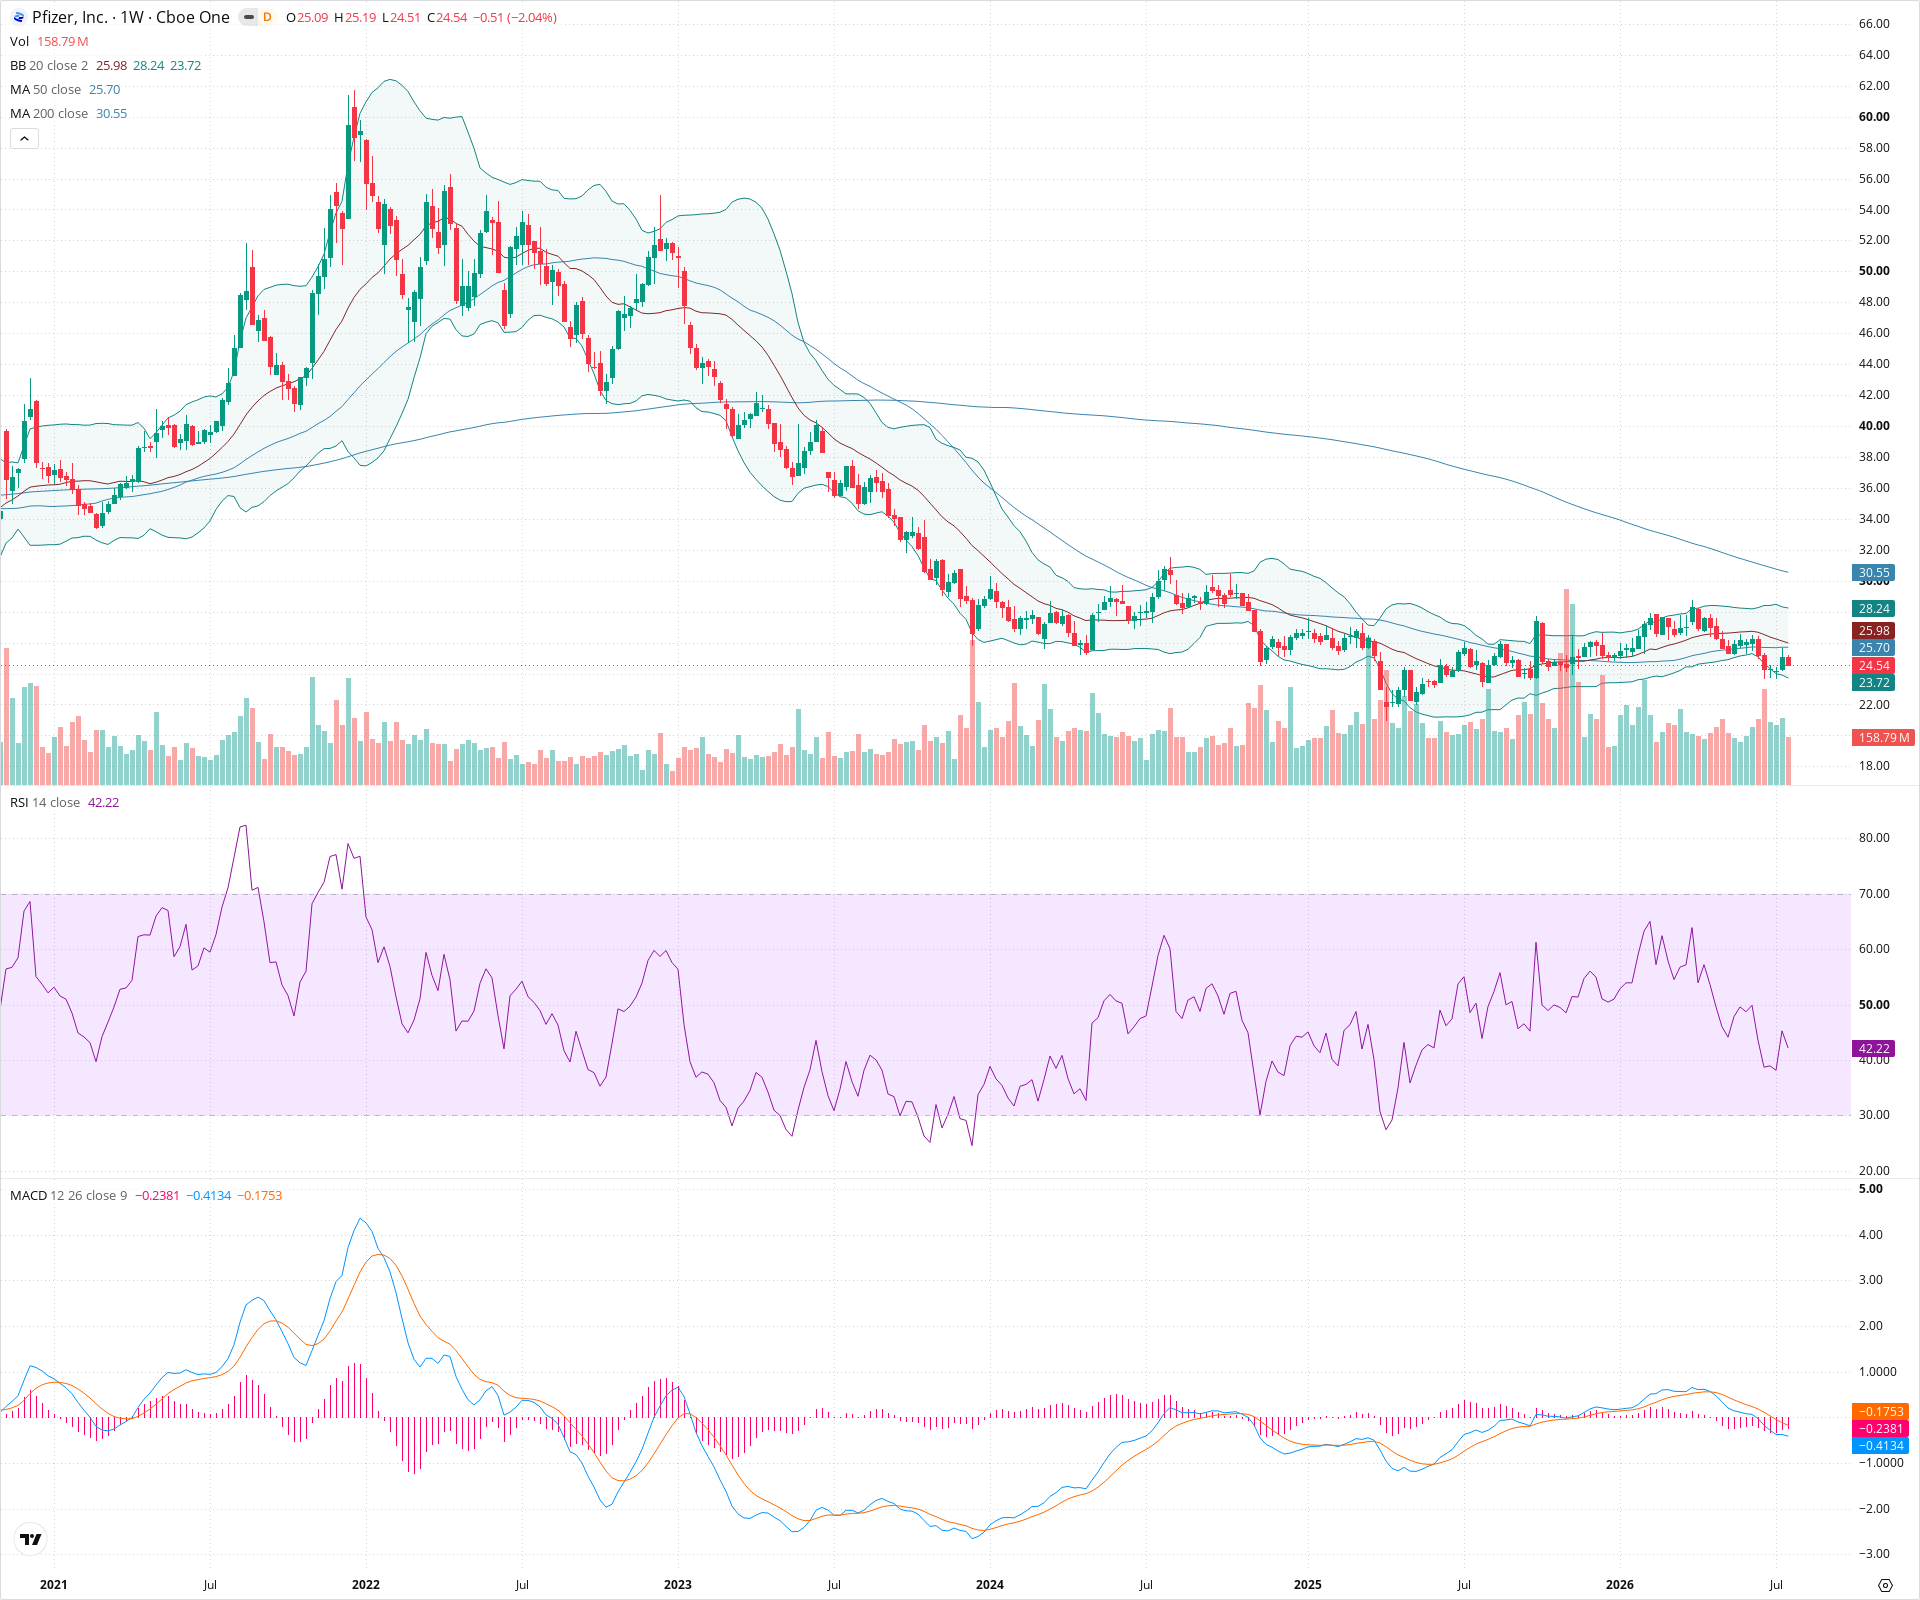
PFE Weekly Chart
Sentiment
Short-term Sentiment (days to weeks): Bearish
Price is breaking down from a recent multi-month consolidation zone, trading below the 20-week and 50-week SMAs. RSI is declining below 50, and the MACD histogram is expanding negatively, confirming downward momentum.
Long-term Sentiment (weeks to months): Bearish
The stock is entrenched in a massive multi-year downtrend, characterized by lower highs and lower lows. Price is trading significantly below a downward-sloping 200-week SMA, with the 50-week SMA also below the 200-week.
Report Metadata
- Timeframe: weekly
- Generated at: 2026-07-25T09:05:58.798Z
- Model: gemini-3.1-pro-preview
Support Price Levels
| Level | Range | Strength | Notes |
|---|---|---|---|
| $24.75 | $24.00 - $25.50 | Strong | Critical historical support zone dating back to early 2021 before the major run-up. The price is currently testing the bottom edge of recent consolidation here. |
Resistance Price Levels
| Level | Range | Strength | Notes |
|---|---|---|---|
| $27.00 | $26.00 - $28.00 | Strong | Former support zone of the recent consolidation phase, now acting as resistance. Confluent with the declining 20-week and 50-week SMAs. |
| $30.75 | $30.00 - $31.50 | Strong | Major structural resistance level and psychological round number, strongly reinforced by the presence of the 200-week SMA. |
Potential Chart Patterns in Formation
| Strength | Pattern | Signal | Target | Details |
|---|---|---|---|---|
| Strong | Consolidation Breakdown | Bearish | N/A | After a multi-month period of sideways trading between roughly $26 and $29, the price has resolved downwards, breaking below the lower boundary of the range. |
Frequently Asked Questions about PFE
What is the current sentiment for PFE?
The short-term sentiment for PFE is currently Bearish because Price is breaking down from a recent multi-month consolidation zone, trading below the 20-week and 50-week SMAs. RSI is declining below 50, and the MACD histogram is expanding negatively, confirming downward momentum.. The long-term trend is classified as Bearish.
What are the key support levels for PFE?
StockDips.AI has identified key support levels for PFE at $24.75. These levels may represent potential accumulation zones where buying interest could emerge.
Is PFE in a significant dip or a Value Dip right now?
PFE has a Value Score of 66/100. It is not currently flagged as a significant dip in the Top Dips list. It is not listed as a Value Dip because the long-term sentiment or value-score threshold does not qualify.
View the full interactive analysis on StockDips.AI.