ASTS Daily Technical Analysis
AST SpaceMobile, Inc
Aerospace and satellite communications company that is building the first and only space-based cellular broadband network designed to connect directly with standard, unmodified mobile phones. The company's mission is to eliminate connectivity gaps globally by providing 4G and 5G coverage in remote and underserved regions where traditional ground infrastructure is unavailable.
ASTS Technical Analysis Summary
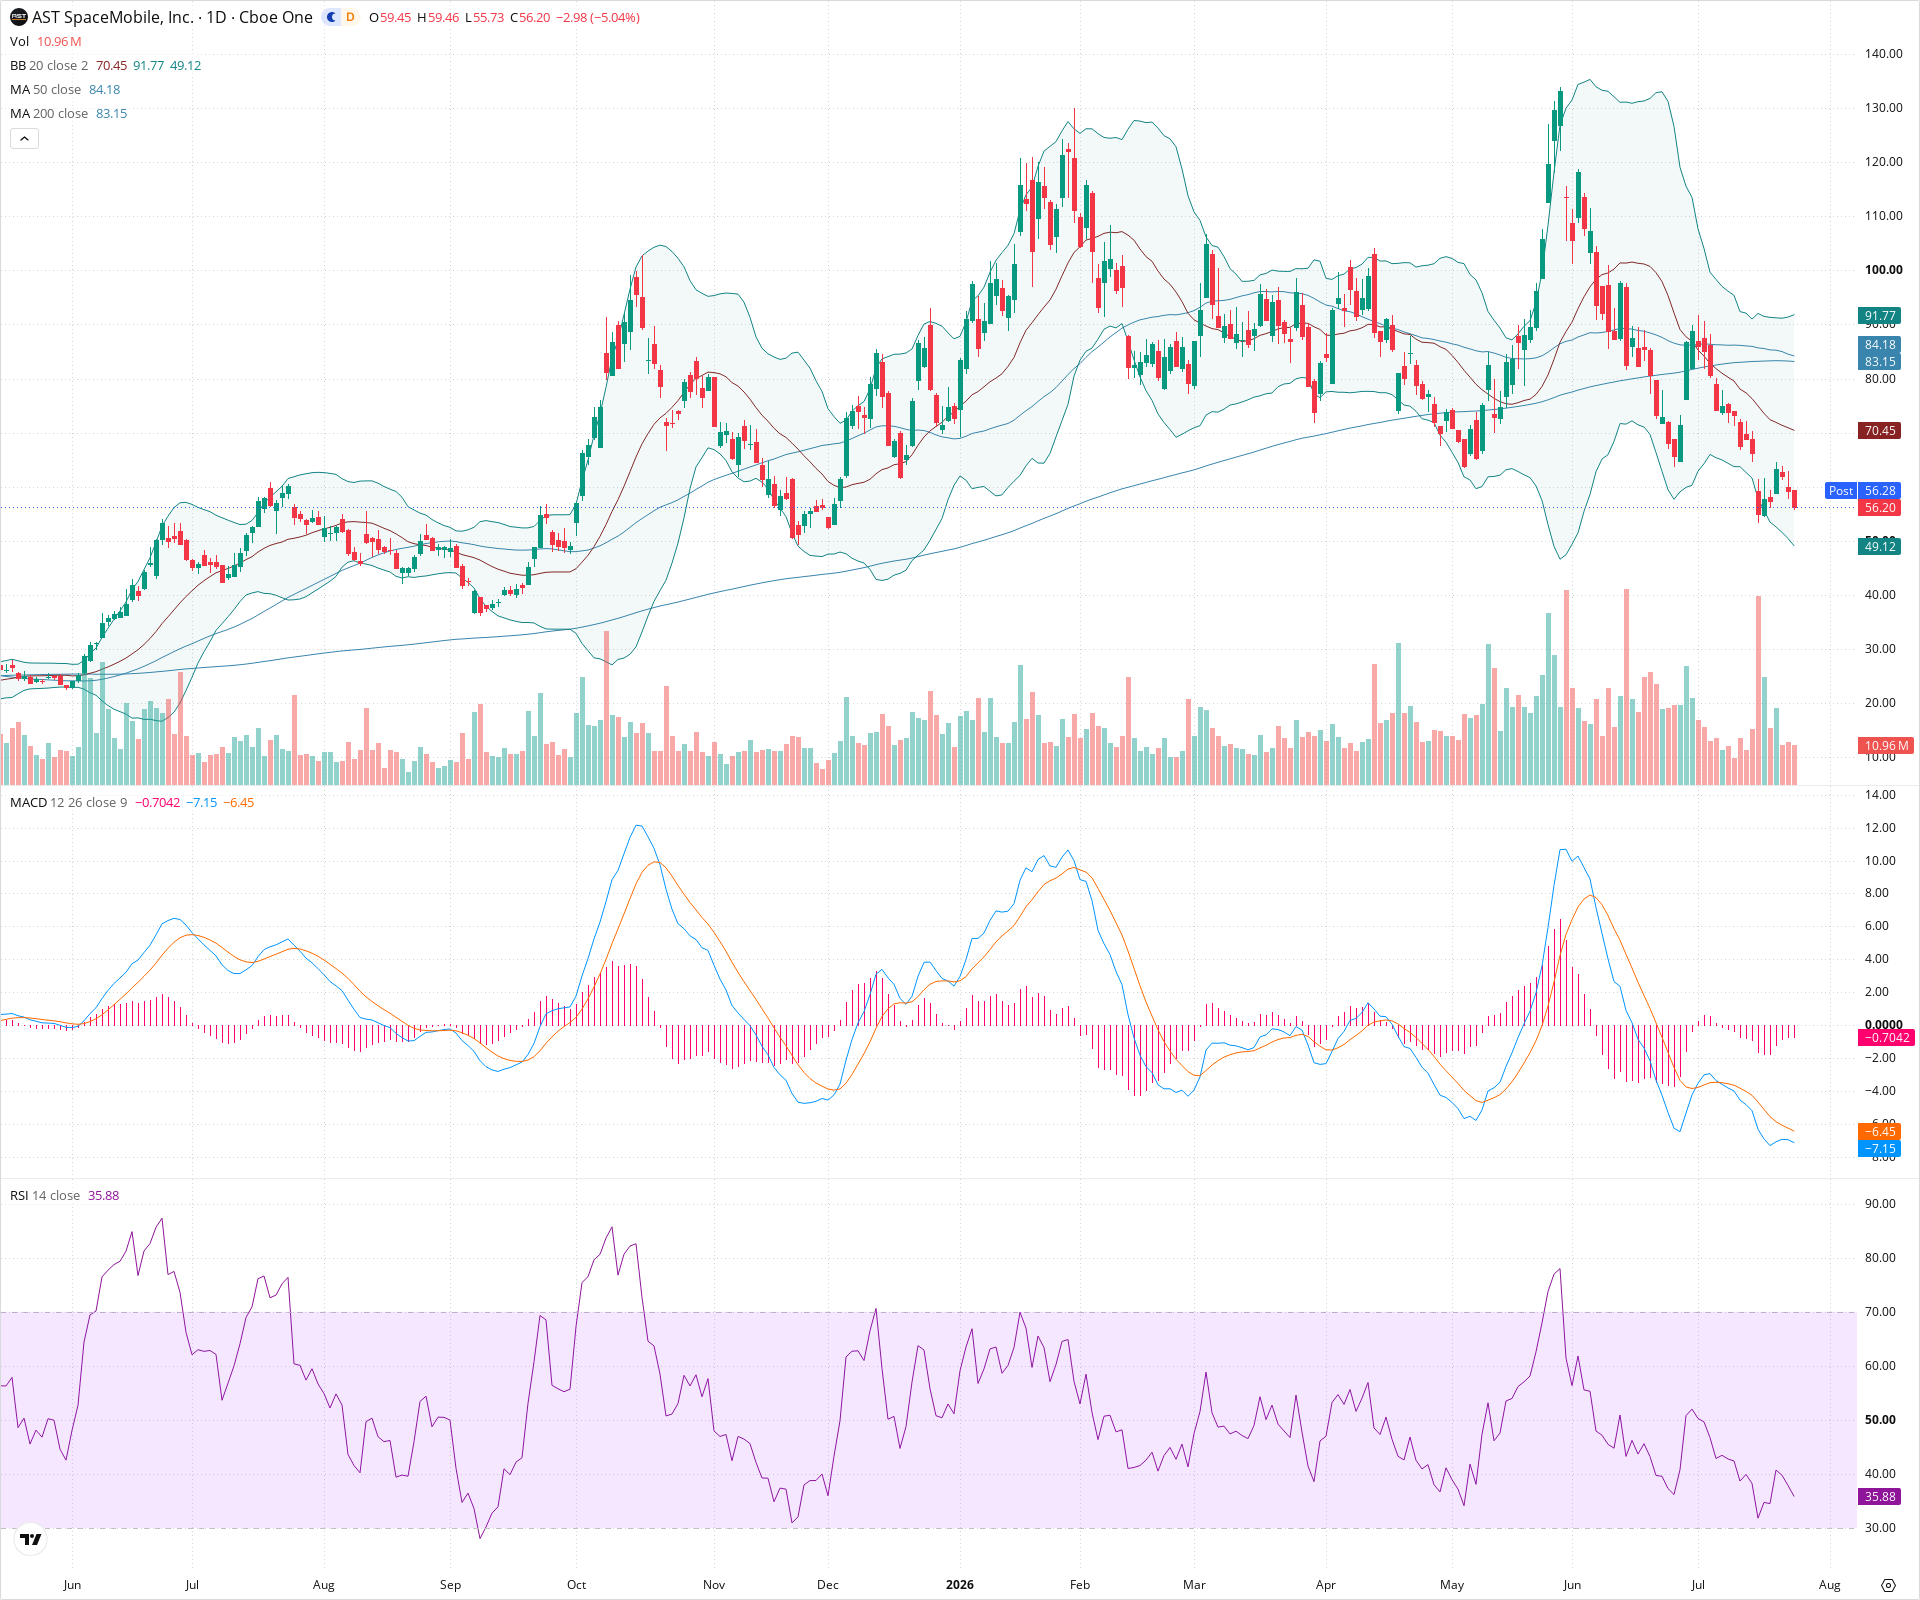
ASTS is firmly entrenched in a primary downtrend, highlighted by a major Head and Shoulders top breakdown and a recent moving average Death Cross. Both short-term and long-term momentum indicators are heavily negative, suggesting further downside risk until a clear reversal pattern or substantial basing action occurs at lower support levels.
Included In Lists
Related Tickers of Interest
ASTS Daily Chart
Sentiment
Short-term Sentiment (days to weeks): Bearish
Price is making lower lows while trading below the 20-day SMA and riding the lower Bollinger Band. The MACD is negative and trending below its signal line, and the RSI is approaching oversold territory, indicating strong downward momentum.
Long-term Sentiment (weeks to months): Bearish
The chart shows a significant breakdown from a large topping structure. The 50-day SMA has recently crossed below the 200-day SMA (Death Cross), confirming a major shift to a long-term downtrend.
Report Metadata
- Timeframe: daily
- Generated at: 2026-07-24T21:10:05.400Z
- Model: gemini-3.1-pro-preview
Support Price Levels
| Level | Range | Strength | Notes |
|---|---|---|---|
| $55.50 | $54.00 - $57.00 | Weak | Immediate support zone based on the current swing lows and recent daily candlestick tails. |
| $47.50 | $45.00 - $50.00 | Strong | Prior consolidation zone from earlier in the chart's history, likely to act as a significant psychological and structural floor. |
Resistance Price Levels
| Level | Range | Strength | Notes |
|---|---|---|---|
| $70.00 | $68.00 - $72.00 | Strong | Current location of the descending 20-day SMA and recent structural breakdown levels. |
| $84.00 | $82.00 - $86.00 | Strong | Major resistance zone where the 50-day and 200-day SMAs have crossed, marking the breakdown of the larger topping pattern. |
Potential Chart Patterns in Formation
| Strength | Pattern | Signal | Target | Details |
|---|---|---|---|---|
| Strong | Head and Shoulders Top | Bearish | $35.00 | A massive topping pattern with a left shoulder formed late last year, a head peaking above 130 early this year, and a right shoulder forming over the summer. The breakdown below the ~80-85 neckline triggered the recent sharp selloff. |
| Strong | Death Cross | Bearish | N/A | The 50-day SMA has crossed below the 200-day SMA, confirming long-term bearish momentum. |
Frequently Asked Questions about ASTS
What is the current sentiment for ASTS?
The short-term sentiment for ASTS is currently Bearish because Price is making lower lows while trading below the 20-day SMA and riding the lower Bollinger Band. The MACD is negative and trending below its signal line, and the RSI is approaching oversold territory, indicating strong downward momentum.. The long-term trend is classified as Bearish.
What are the key support levels for ASTS?
StockDips.AI has identified key support levels for ASTS at $55.50 and $47.50. These levels may represent potential accumulation zones where buying interest could emerge.
Is ASTS in a significant dip or a Value Dip right now?
ASTS has a Value Score of 95/100. It is currently flagged as a significant dip in the Top Dips list. It is not listed as a Value Dip because the long-term sentiment or value-score threshold does not qualify.
View the full interactive analysis on StockDips.AI.