SRPT Daily Technical Analysis
Sarepta Therapeutics, Inc
Biopharmaceutical company specializing in precision genetic medicines for rare neuromuscular diseases, particularly Duchenne muscular dystrophy (DMD)
SRPT Technical Analysis Summary
SRPT exhibits a firmly bearish technical posture across multiple timeframes. The stock is constrained below declining 50-day and 200-day moving averages, and recent price action shows a breakdown from a consolidation pattern. With momentum indicators corroborating the downward pressure, the bias remains to the downside, with a potential deeper test of historical support levels if current near-term support fails.
Included In Lists
Related Tickers of Interest
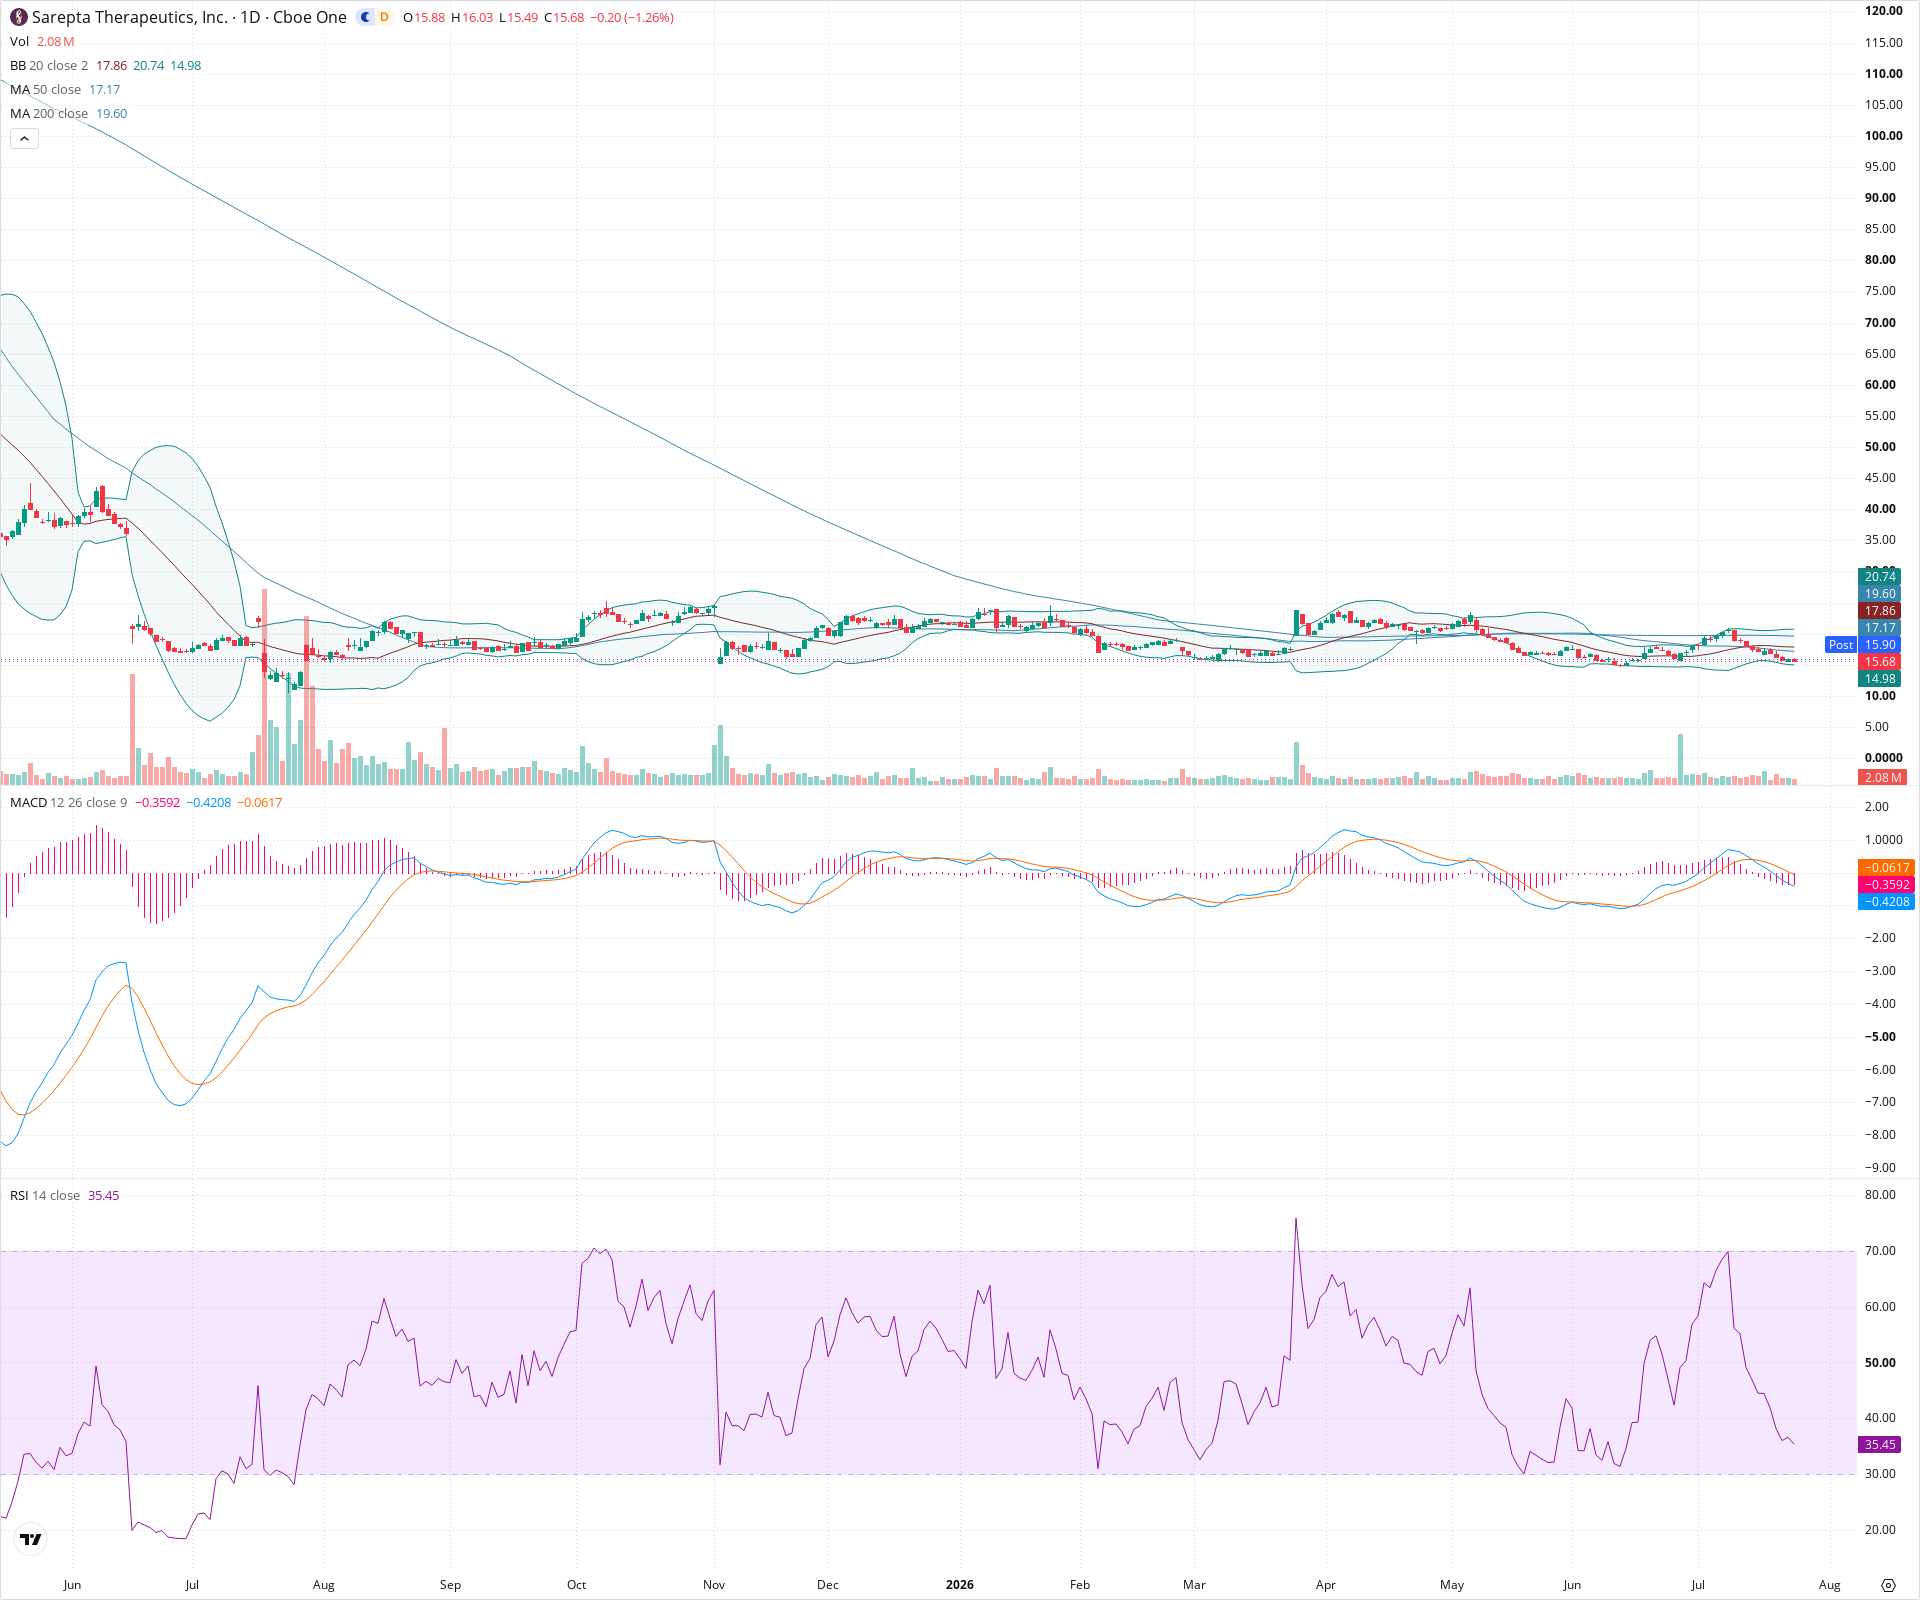
SRPT Daily Chart
Sentiment
Short-term Sentiment (days to weeks): Bearish
Price is trading below both the 20-day and 50-day SMAs. Momentum is negative, with RSI falling towards oversold territory (35.45) and the MACD line crossing below the signal line with an expanding negative histogram.
Long-term Sentiment (weeks to months): Bearish
The stock is entrenched in a long-term downtrend, characterized by price remaining consistently below a declining 200-day SMA. The 50-day SMA is also trending lower beneath the 200-day SMA, confirming structural weakness.
Report Metadata
- Timeframe: daily
- Generated at: 2026-07-24T21:06:32.301Z
- Model: gemini-3.1-pro-preview
Support Price Levels
| Level | Range | Strength | Notes |
|---|---|---|---|
| $15.00 | $14.80 - $15.20 | Weak | Immediate minor support zone aligning with the lower Bollinger Band and recent intraday lows. |
| $12.00 | $11.50 - $12.50 | Strong | Major historical support level established by the swing low following the massive gap down earlier in the charted period. |
Resistance Price Levels
| Level | Range | Strength | Notes |
|---|---|---|---|
| $17.25 | $17.00 - $17.50 | Strong | Key near-term resistance zone formed by the declining 50-day SMA and recent swing highs where rallies were rejected. |
| $20.00 | $19.50 - $20.50 | Strong | Significant overhead resistance encompassing the 200-day SMA and the upper boundary of the multi-month consolidation range. |
Potential Chart Patterns in Formation
| Strength | Pattern | Signal | Target | Details |
|---|---|---|---|---|
| Strong | Descending Triangle Breakdown | Bearish | $12.50 | The stock formed a series of lower highs while testing horizontal support near the 15.50-16.00 area. Current price action indicates a breakdown below this support, suggesting a bearish continuation. |
Frequently Asked Questions about SRPT
What is the current sentiment for SRPT?
The short-term sentiment for SRPT is currently Bearish because Price is trading below both the 20-day and 50-day SMAs. Momentum is negative, with RSI falling towards oversold territory (35.45) and the MACD line crossing below the signal line with an expanding negative histogram.. The long-term trend is classified as Bearish.
What are the key support levels for SRPT?
StockDips.AI has identified key support levels for SRPT at $15.00 and $12.00. These levels may represent potential accumulation zones where buying interest could emerge.
Is SRPT in a significant dip or a Value Dip right now?
SRPT has a Value Score of 70/100. It is not currently flagged as a significant dip in the Top Dips list. It is not listed as a Value Dip because the long-term sentiment or value-score threshold does not qualify.
View the full interactive analysis on StockDips.AI.